972 Shoppers Row
Campbell River, BC V9W 2C5
Victoria Market Report Infographics
INFOGRAPHICS: September 2026 VREB Victoria Market Reports

Victoria Real Estate Market Report for September 2026
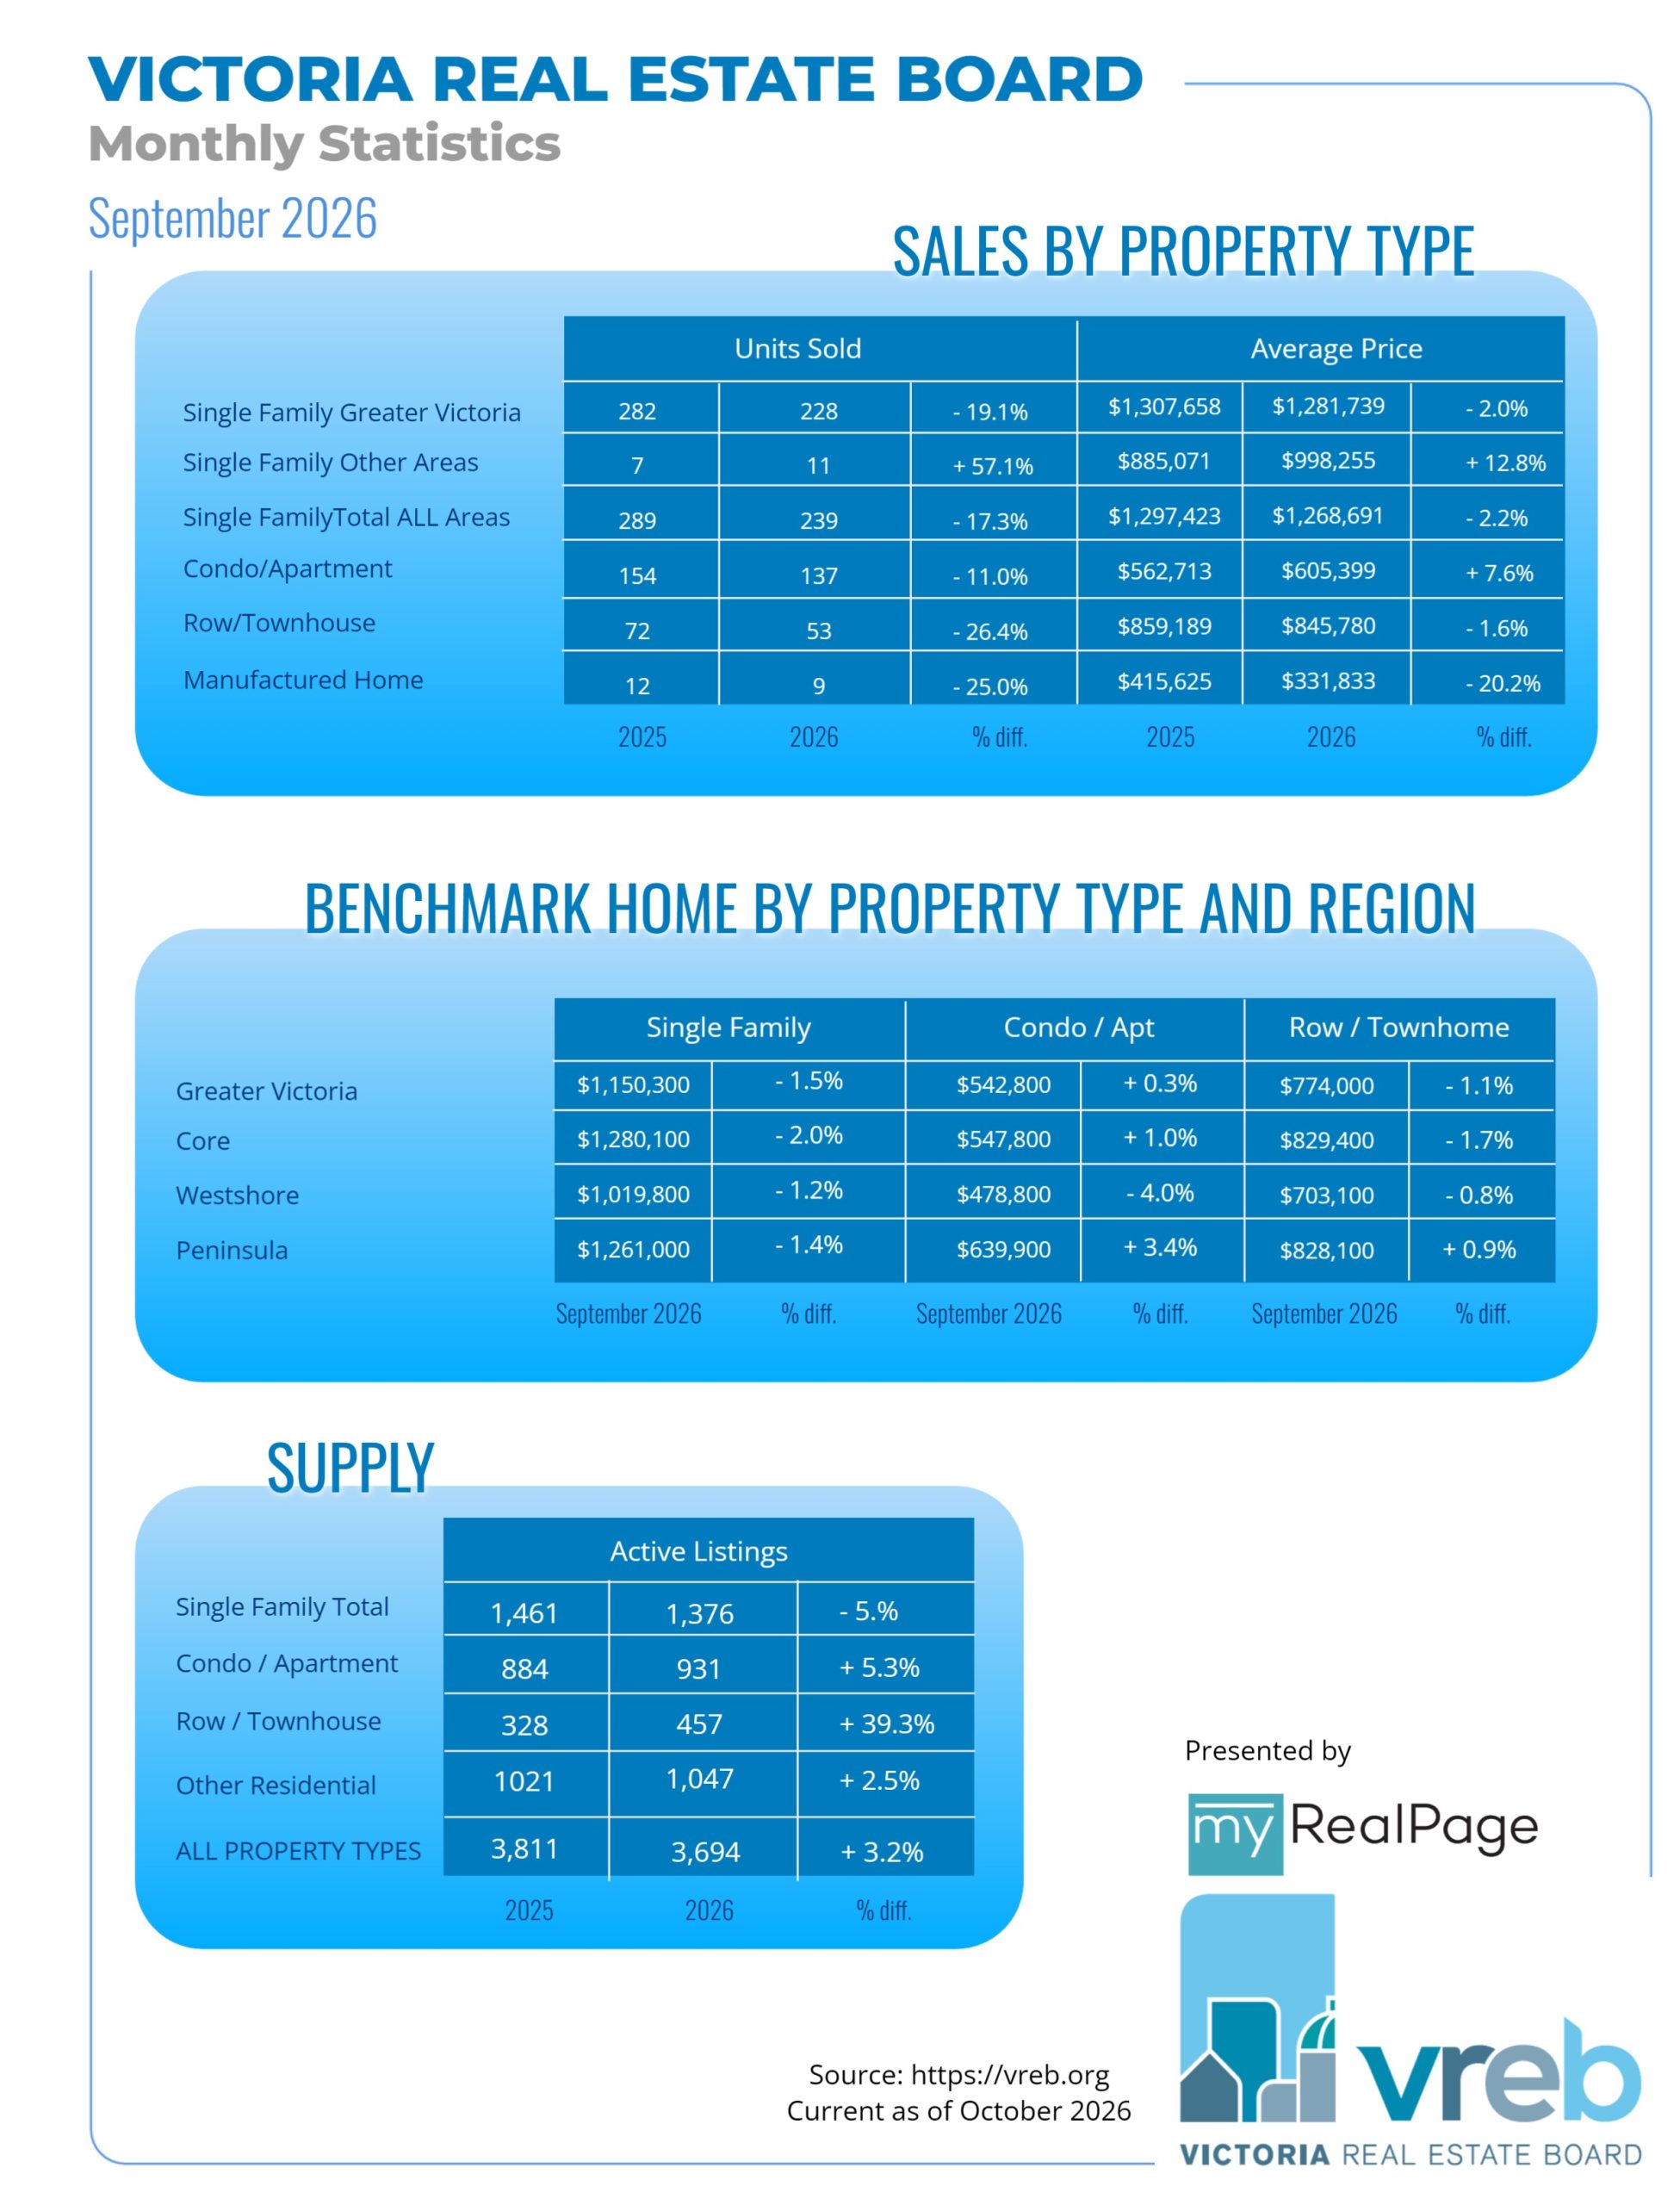
A total of 463 properties were sold in the Victoria Real Estate Board region this September, 16.4 per cent fewer than the 554 properties sold in September 2025 and 21.7 per cent fewer than August 2026. Sales of condominiums decreased by 11 per cent from September 2025, with 137 units sold. Sales of single family homes decreased by 17.3 per cent from September 2025, with 239 sold.
“September closed with inventory levels outpacing sales to a degree we haven’t seen in many years,” said Victoria Real Estate Board Chair Fergus Kyne. “The numbers indicate that the Victoria housing market has ventured into buyer’s market territory. Excluding the months from the start of the pandemic, this is the first time we’ve seen a buyer’s market since January 2015. However, one month does not make a trend, and it’s too early to say whether market conditions have shifted for the longer term. We’ll be watching the data closely over the coming months to see whether this is the beginning of a trend we haven’t experienced in more than a decade.”
There were 3,811 active listings for sale on the Victoria Real Estate Board Multiple Listing Service® at the end of September 2026, an increase of 4.1 per cent compared to the previous month of August and a 3.2 per cent increase from the 3,694 active listings for sale at the end of September 2025.
“There is a strong supply of inventory available in our market right now,” notes Chair Kyne. “But there is also a lack of certainty in many other aspects of our lives that may be contributing to lower sales activity. If you’re a qualified buyer and you’re looking for a new home, this might be a good time, because inventory generally decreases into the winter and your choices may not be as diverse as they are right now. For sellers, it’s important to have a conversation with your REALTOR® about the current market value of your specific property and how your expectations align with today’s market conditions in your market segment. September’s market looked very different from July and August, and conditions could shift again in October and the months ahead. That is why advice from a trusted local REALTOR® is so valuable when navigating a dynamic marketplace.”
Read the full report on VREB website!
The following data is a comparison between September 2026 and September 2025 numbers, and is current as of October 2026. Click here to check out last month’s figures!
You can also follow this link for all our Victoria Board monthly infographics!
Click on the images for a larger view!
Download Printable Version – September 2026 VREB, Victoria Market Report
INFOGRAPHICS: August 2026 VREB Victoria Market Reports
Victoria Real Estate Market Report for August 2026
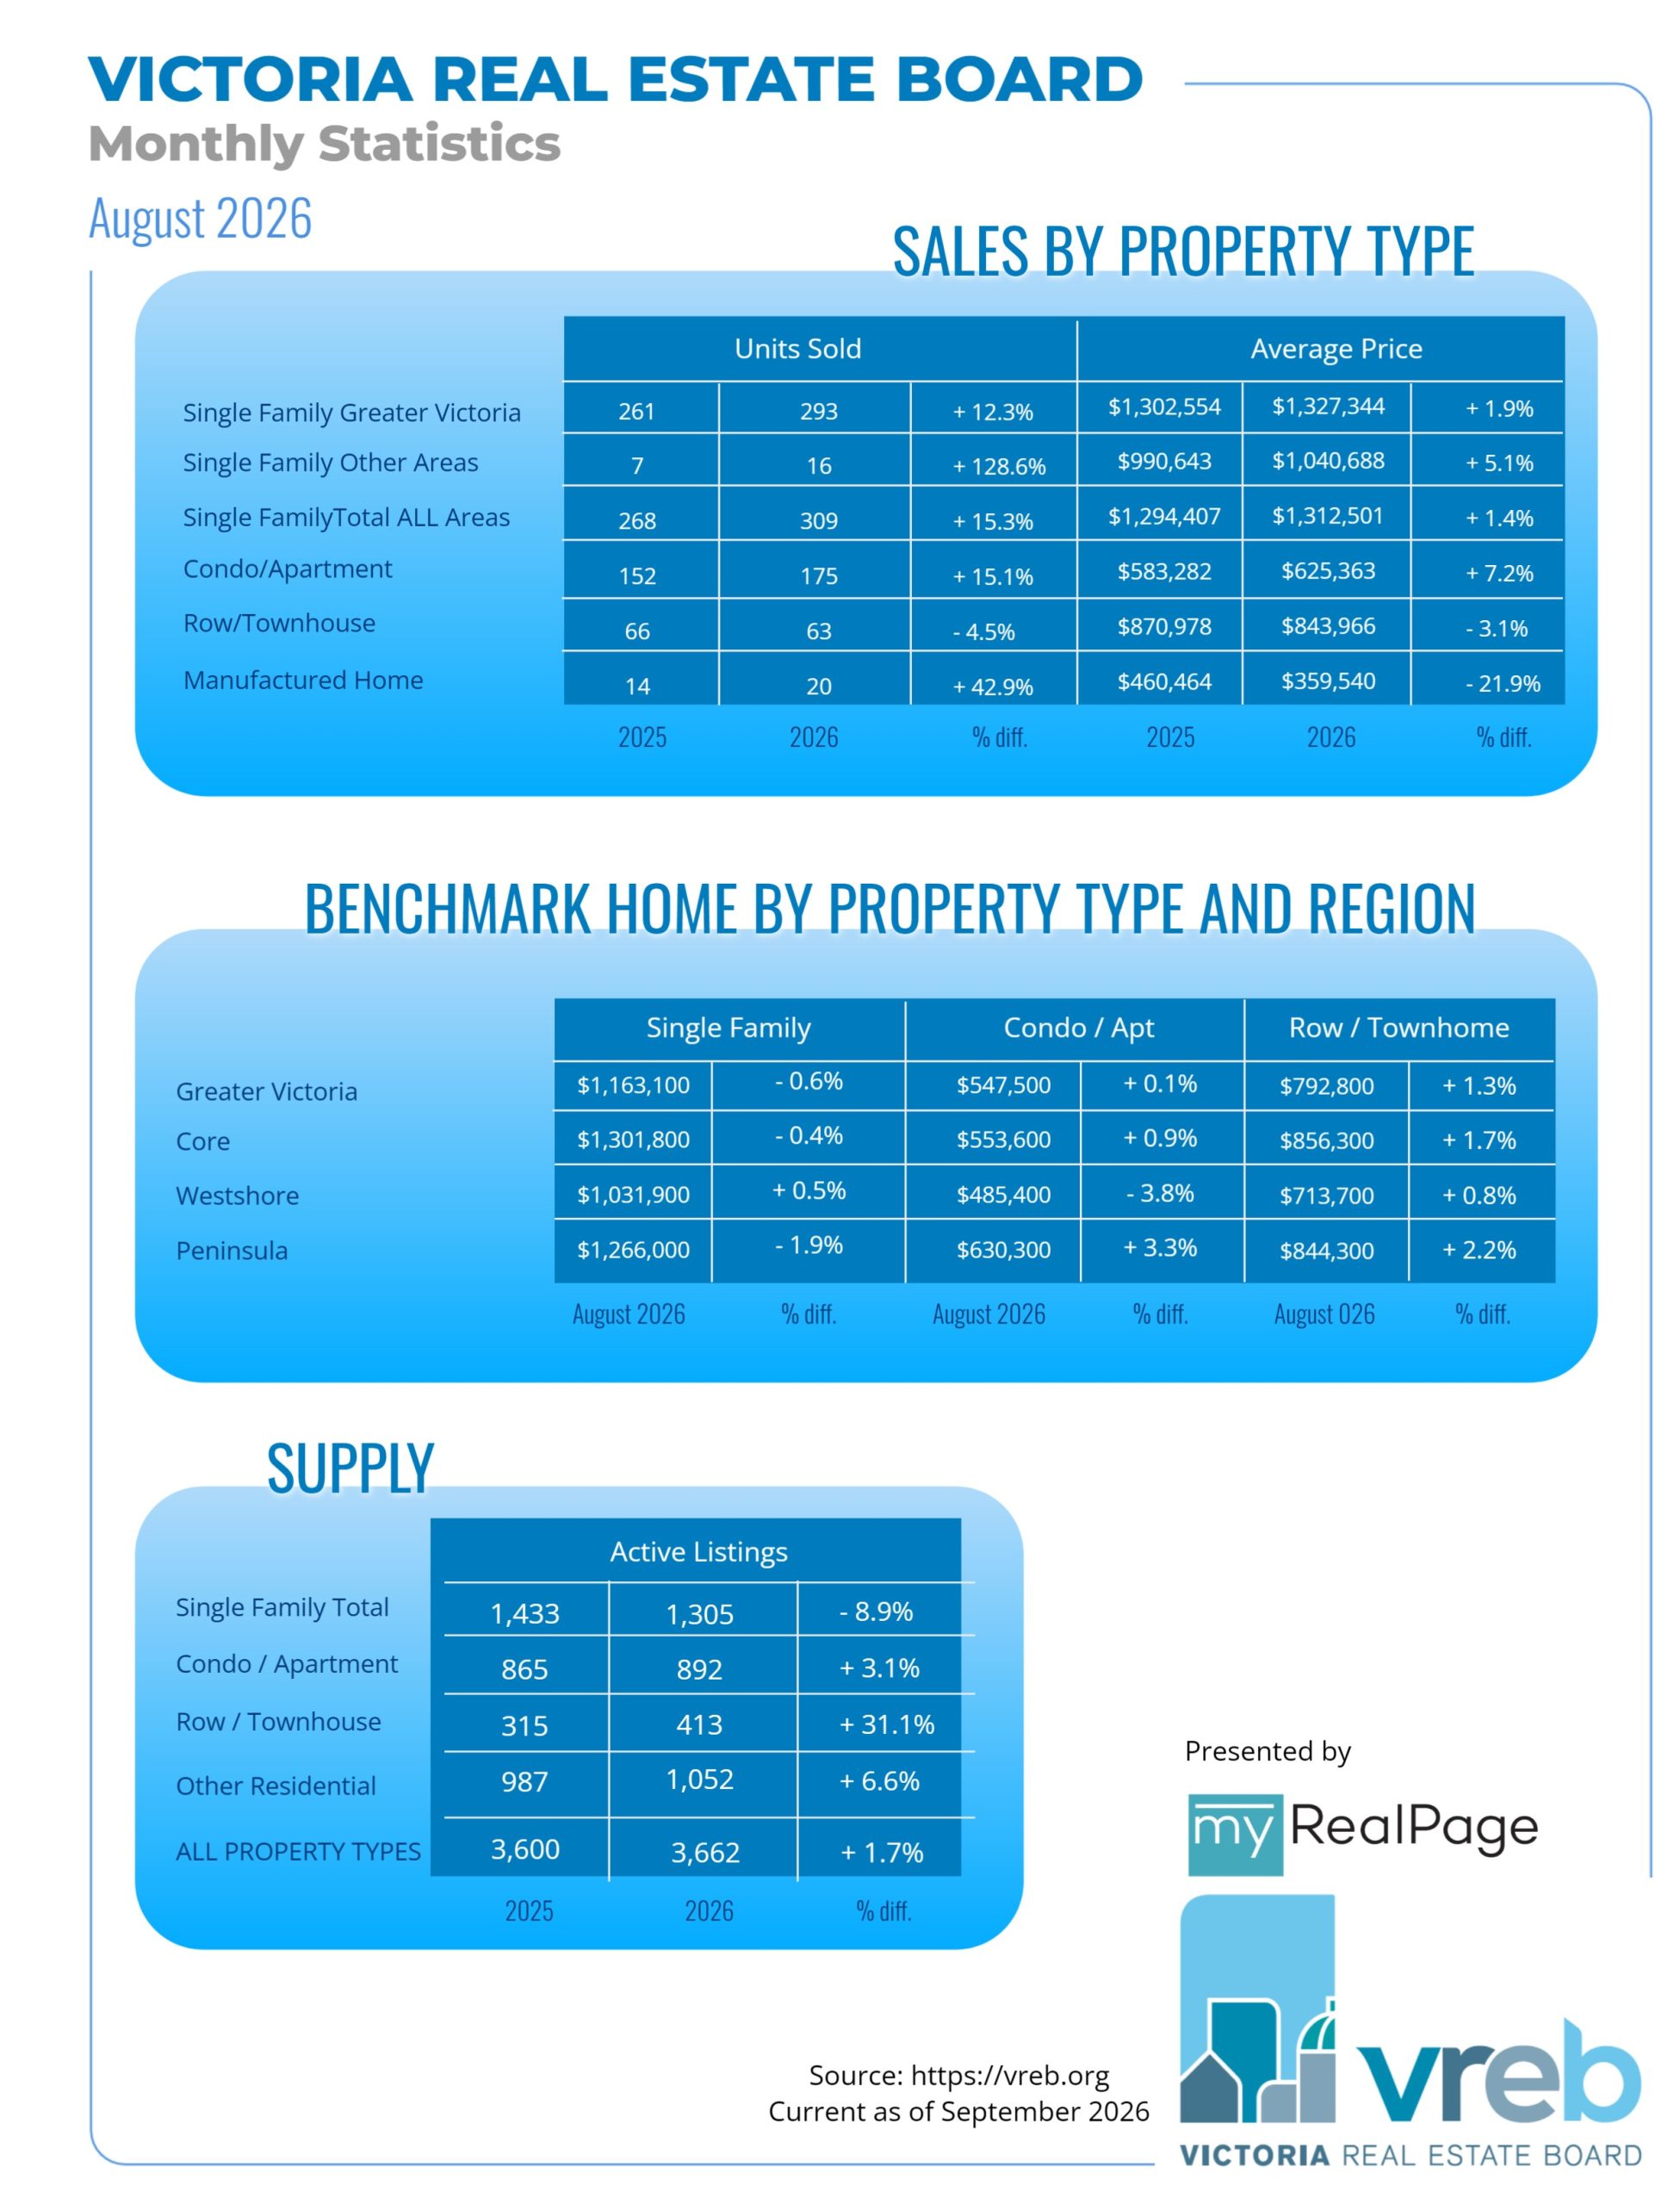
A total of 591 properties were sold in the Victoria Real Estate Board region this August, 12.6 per cent more than the 525 properties sold in August 2025 and 12.2 per cent fewer than July 2026. Sales of condominiums increased by 15.1 per cent from August 2025, with 175 units sold. Sales of single family homes increased by 15.3 per cent from August 2025, with 309 sold.
“The August real estate market in Greater Victoria continued to demonstrate steady momentum,” said Victoria Real Estate Board Chair Fergus Kyne. “Sales activity for the month was stronger than we’ve seen in five years, while inventory remained at healthy levels. These conditions continue to support our stable, balanced market.”
There were 3,662 active listings for sale on the Victoria Real Estate Board Multiple Listing Service® at the end of August 2026, a decrease of 4.8 per cent compared to the previous month of July and a 1.7 per cent increase from the 3,600 active listings for sale at the end of August 2025.
“Just like in the spring, buyers continue to be selective, and homes that are well-priced and well-presented are attracting the strongest interest,” notes Chair Kyne. “The current level of inventory gives buyers time to evaluate their options, but it also means that sellers need to understand how their property compares to others on the market. Working with a REALTOR® is the best way to understand your home’s current market value and how to position your home for sale.”
Read the full report on VREB website!
The following data is a comparison between August 2026 and August 2025 numbers, and is current as of September 2026. Click here to check out last month’s figures!
You can also follow this link for all our Victoria Board monthly infographics!
Click on the images for a larger view!
Download Printable Version – August 2026 VREB, Victoria Market Report
INFOGRAPHICS: July 2026 VREB Victoria Market Reports
Victoria Real Estate Market Report for July 2026
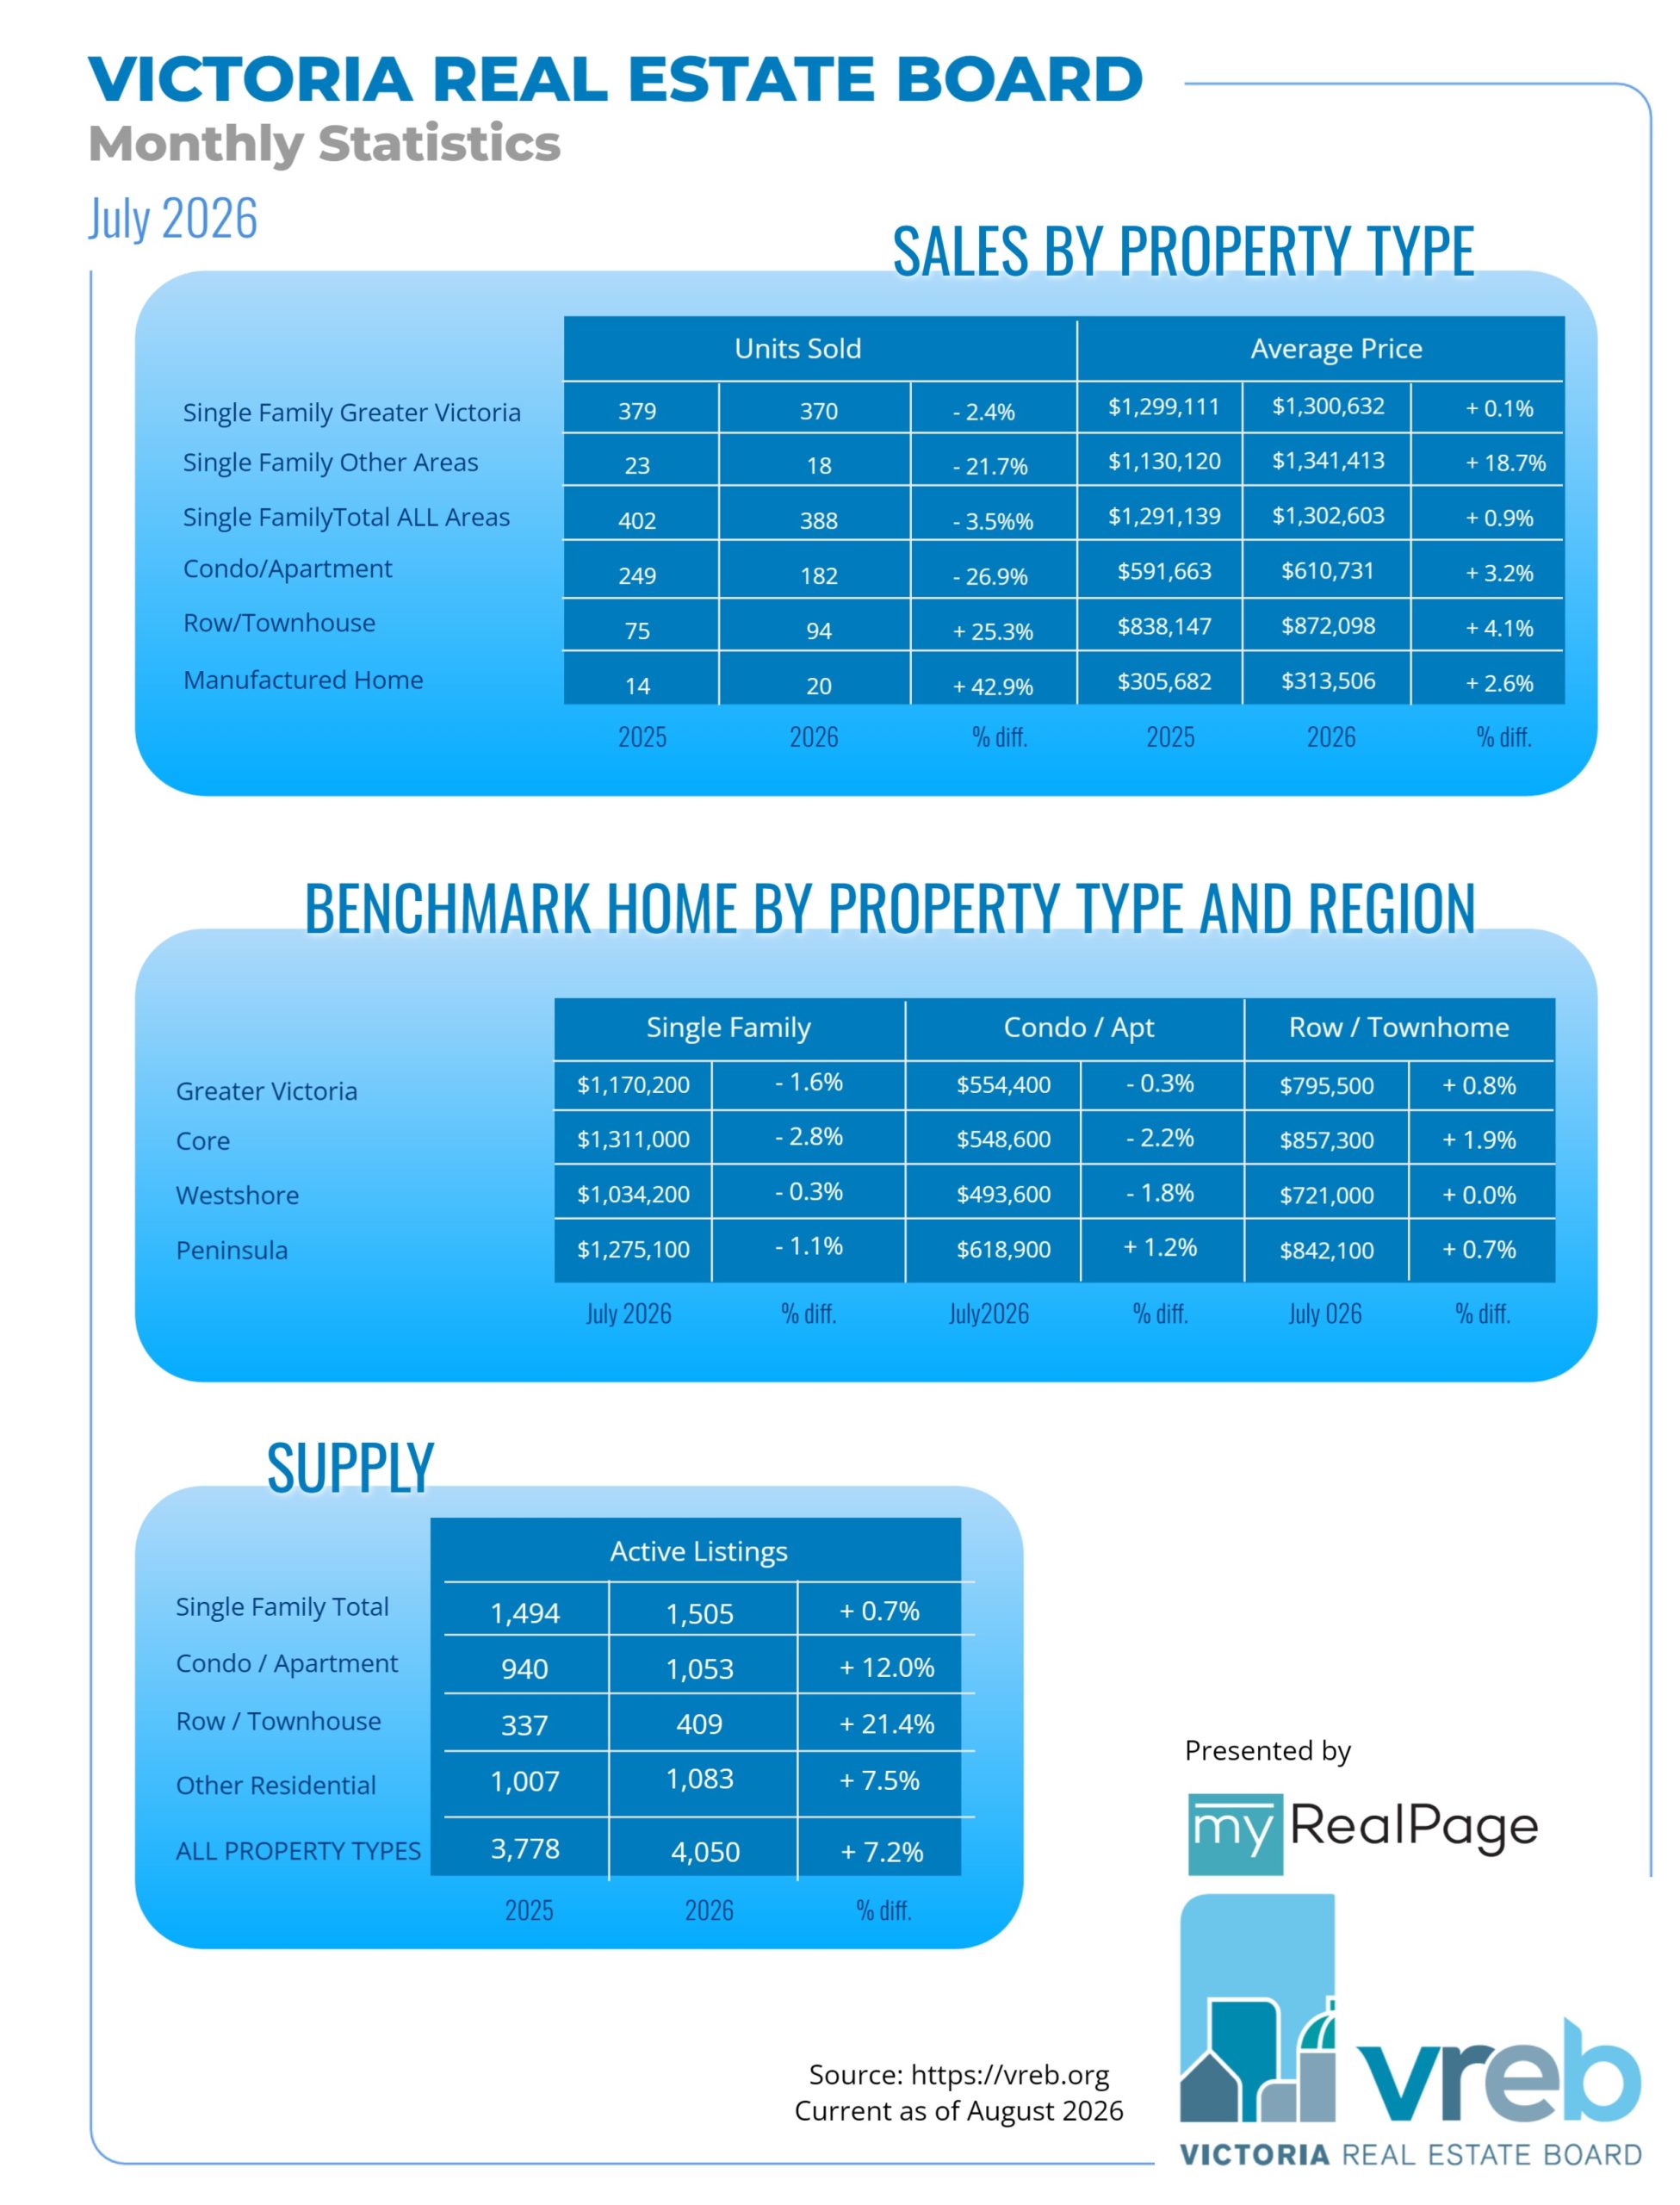
A total of 673 properties were sold in the Victoria Real Estate Board region this July, 1 per cent fewer than the 680 properties sold in July 2025 and 6.4 per cent fewer than sold in June 2026. Sales of condominiums decreased by 7.1 per cent from July 2025, with 209 units sold. Sales of single family homes increased by 4.1 per cent from July 2025, with 331 sold.
“It was a solid month for sales,” said Victoria Real Estate Board Chair Fergus Kyne. “We ended the month above the five-year average for number of sales in a July. What’s different about this market is the availability of inventory, and how the generous number of homes for sale impact both the seller and buyer experience. Buyers are taking more time to make decisions because of all the options available. Some buyers may even feel overwhelmed as they navigate a market with so much choice. If you’re shopping for homes right now, your REALTOR® can help explore the properties that have the best current and future potential, identify where smart compromises may be made, and focus on what features matter the most.”
There were 3,847 active listings for sale on the Victoria Real Estate Board Multiple Listing Service® at the end of July 2026, a decrease of 5.1 per cent compared to the previous month of June and a 3.9 per cent increase from the 3,703 active listings for sale at the end of July 2025.
Read the full report on VREB website!
The following data is a comparison between July 2026 and July 2025 numbers, and is current as of August 2026. Click here to check out last month’s figures!
You can also follow this link for all our Victoria Board monthly infographics!
Click on the images for a larger view!
Download Printable Version – July 2026 VREB, Victoria Market Report
INFOGRAPHICS: June 2026 VREB Victoria Market Reports
Victoria Real Estate Market Report for June 2026
A total of 579 properties sold in the Victoria Real Estate Board region this March, 5.5 per cent fewer than the 613 properties sold in March 2025 and 24.5 per cent more than in February 2026. Sales of condominiums decreased by 18.8 per cent from March 2025 with 164 units sold. Sales of single family homes decreased by 2.4 per cent from March 2025 with 285 sold.
“Our market is following a fairly typical spring market trend,” said Victoria Real Estate Board Chair Fergus Kyne. “With sales and listings both increasing from the previous month, we’re tracking a seasonal pattern that generally builds to the peak of the market in May or June.”
There were 3,261 active listings for sale on the Victoria Real Estate Board Multiple Listing Service® at the end of March 2026, an increase of 12.3 per cent compared to the previous month of February and a 7.9 per cent increase from the 3,023 active listings for sale at the end of March 2025.
Read the full report on VREB website!
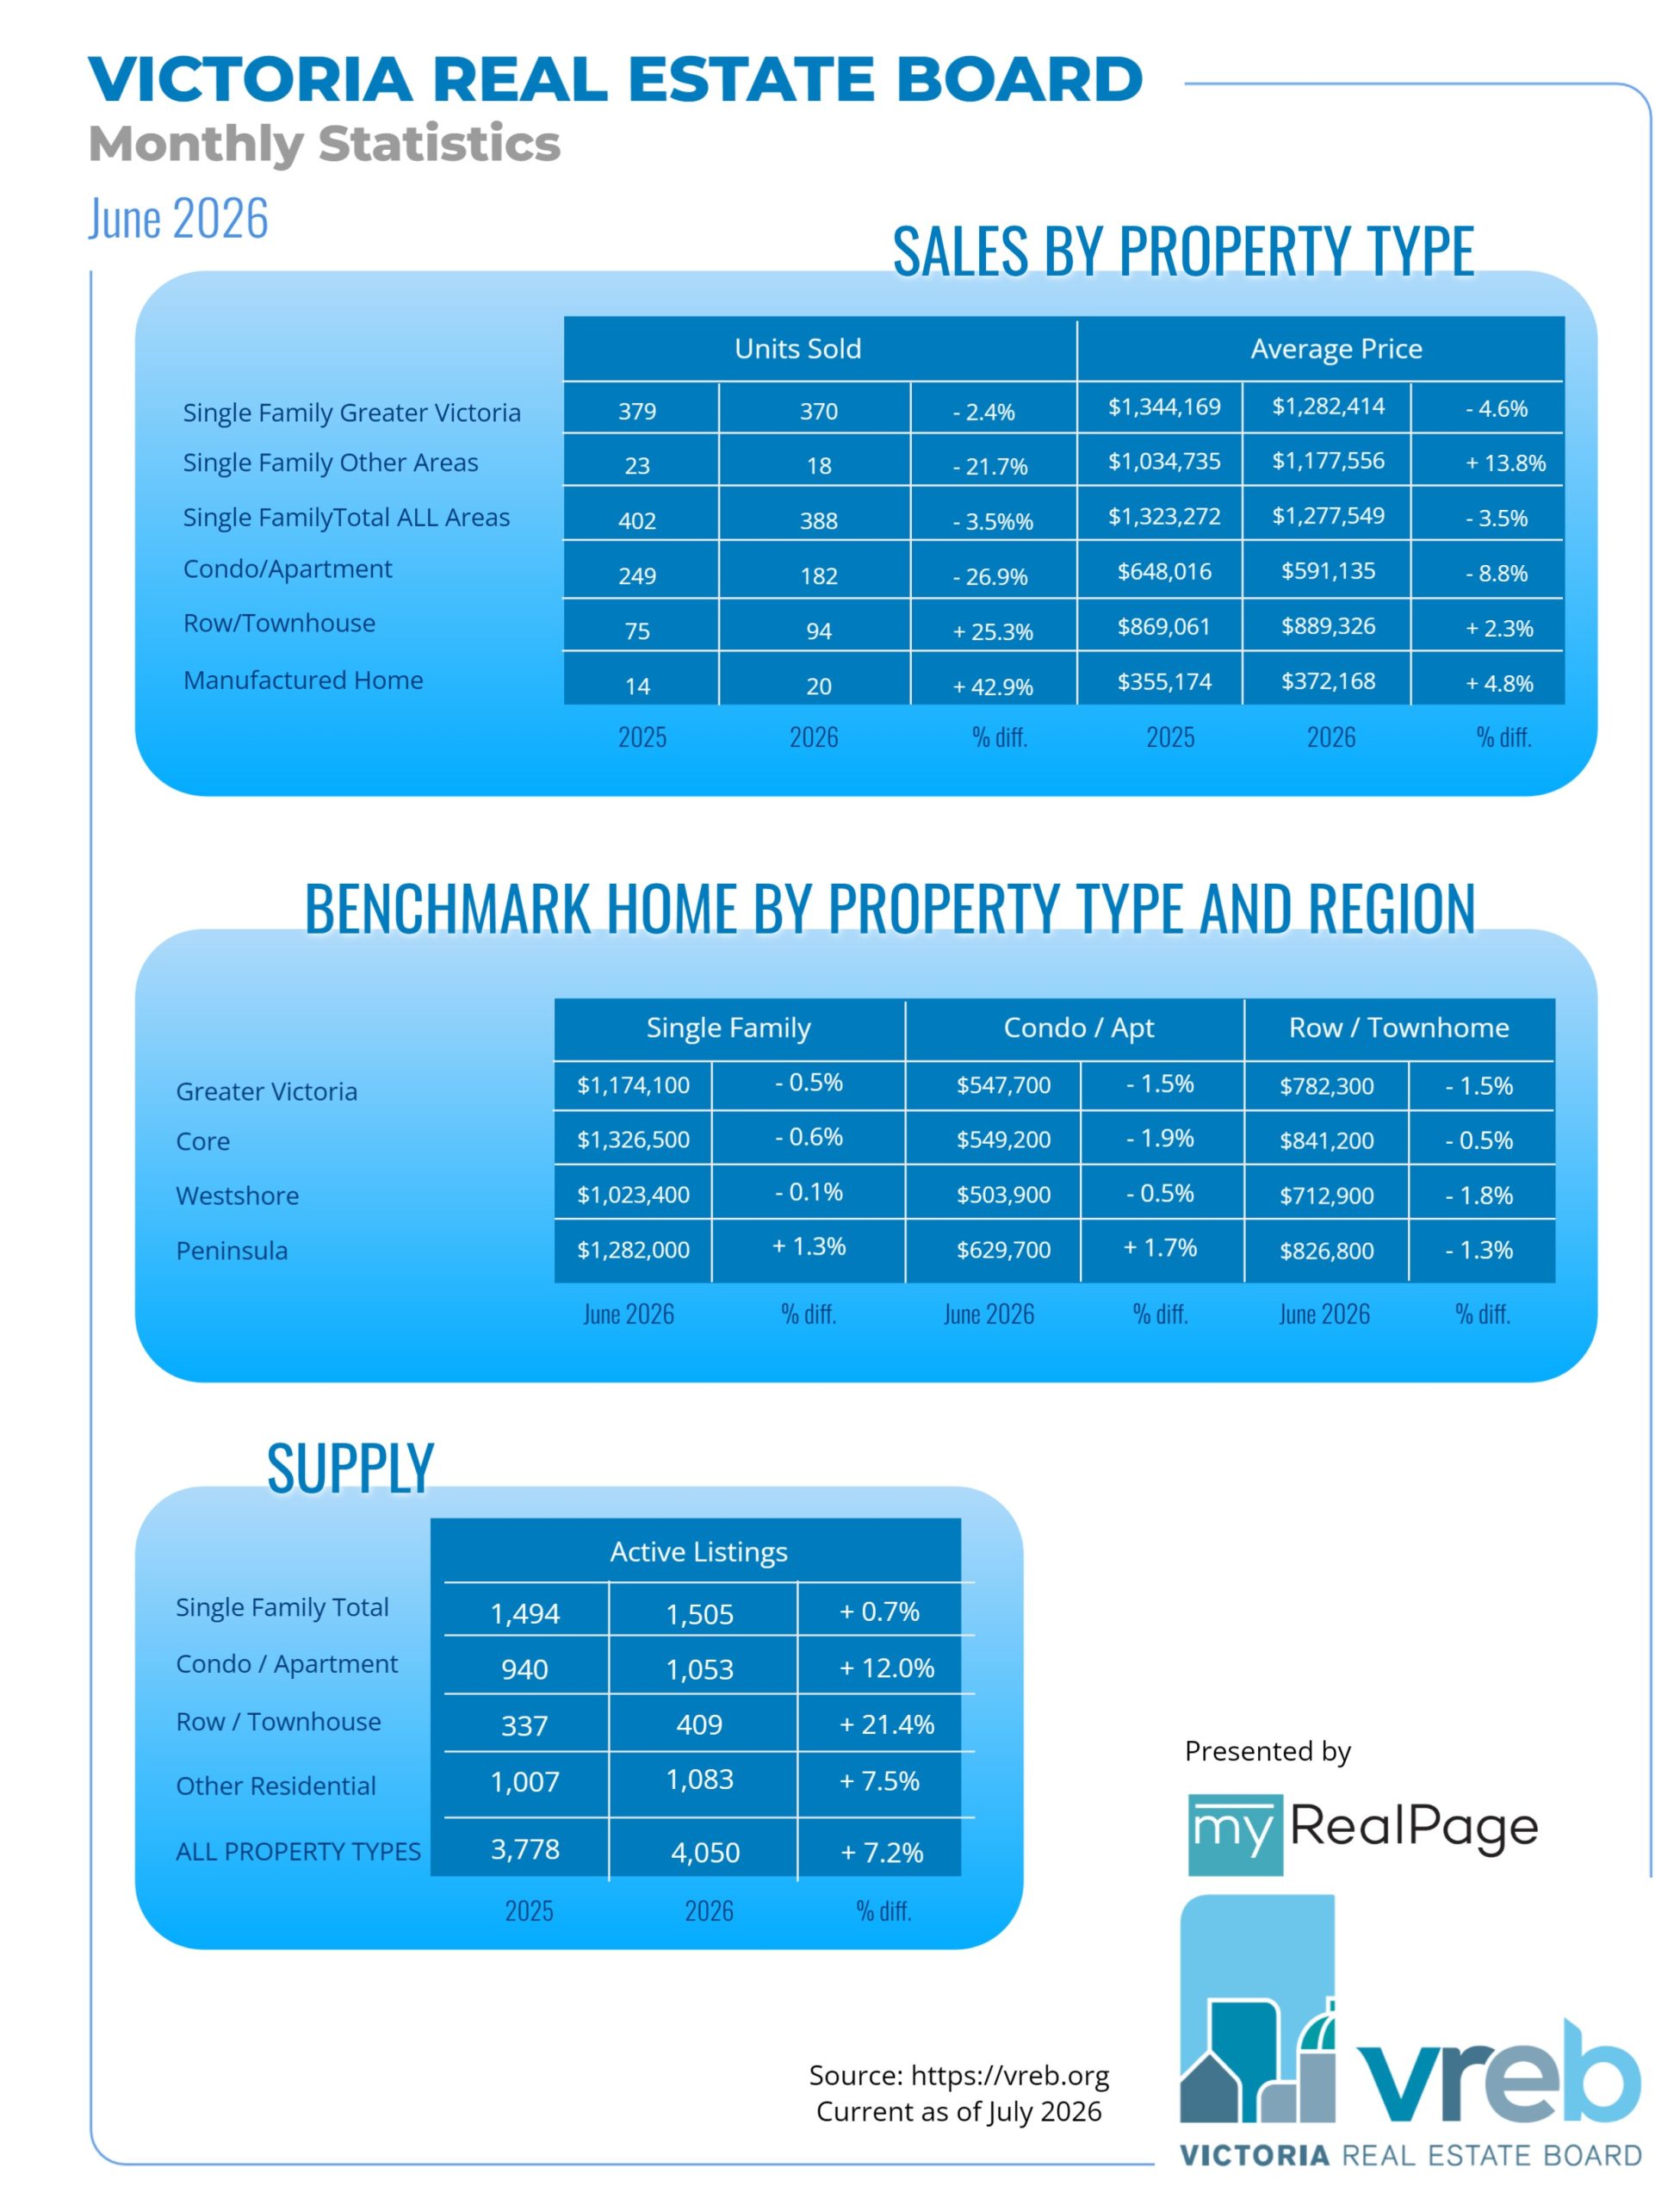
The following data is a comparison between June 2026 and June 2025 numbers, and is current as of July 2026. Click here to check out last month’s figures!
You can also follow this link for all our Victoria Board monthly infographics!
Click on the images for a larger view!
Download Printable Version – June 2026 VREB, Victoria Market Report
INFOGRAPHICS: May 2026 VREB Victoria Market Reports
Victoria Real Estate Market Report for May 2026
A total of 579 properties sold in the Victoria Real Estate Board region this March, 5.5 per cent fewer than the 613 properties sold in March 2025 and 24.5 per cent more than in February 2026. Sales of condominiums decreased by 18.8 per cent from March 2025 with 164 units sold. Sales of single family homes decreased by 2.4 per cent from March 2025 with 285 sold.
“Our market is following a fairly typical spring market trend,” said Victoria Real Estate Board Chair Fergus Kyne. “With sales and listings both increasing from the previous month, we’re tracking a seasonal pattern that generally builds to the peak of the market in May or June.”
There were 3,261 active listings for sale on the Victoria Real Estate Board Multiple Listing Service® at the end of March 2026, an increase of 12.3 per cent compared to the previous month of February and a 7.9 per cent increase from the 3,023 active listings for sale at the end of March 2025. “We continue to observe a market which offers plentiful opportunity for both buyers and sellers.
The current conditions of good supply and a reasonable level of consumer demand have created fewer high-pressure transactions and allowed time for both sides of the sale to make decisions and undertake due diligence,” notes Chair Kyne. “Every listing is unique in our market. Greater Victoria is a relatively small area which consists of many micro markets with varying conditions and demand. It’s a good time to connect with your favourite local REALTOR® to ensure your property or your purchase gets the correct analysis and strategy it deserves.”
Read the full report on VREB website!
The following data is a comparison between May 2026 and May 2025 numbers, and is current as of June 2026. Click here to check out last month’s figures!
You can also follow this link for all our Victoria Board monthly infographics!
Click on the images for a larger view!
Download Printable Version – May 2026 VREB, Victoria Market Report
INFOGRAPHICS: April 2026 VREB Victoria Market Reports
Victoria Real Estate Market Report for April 2026
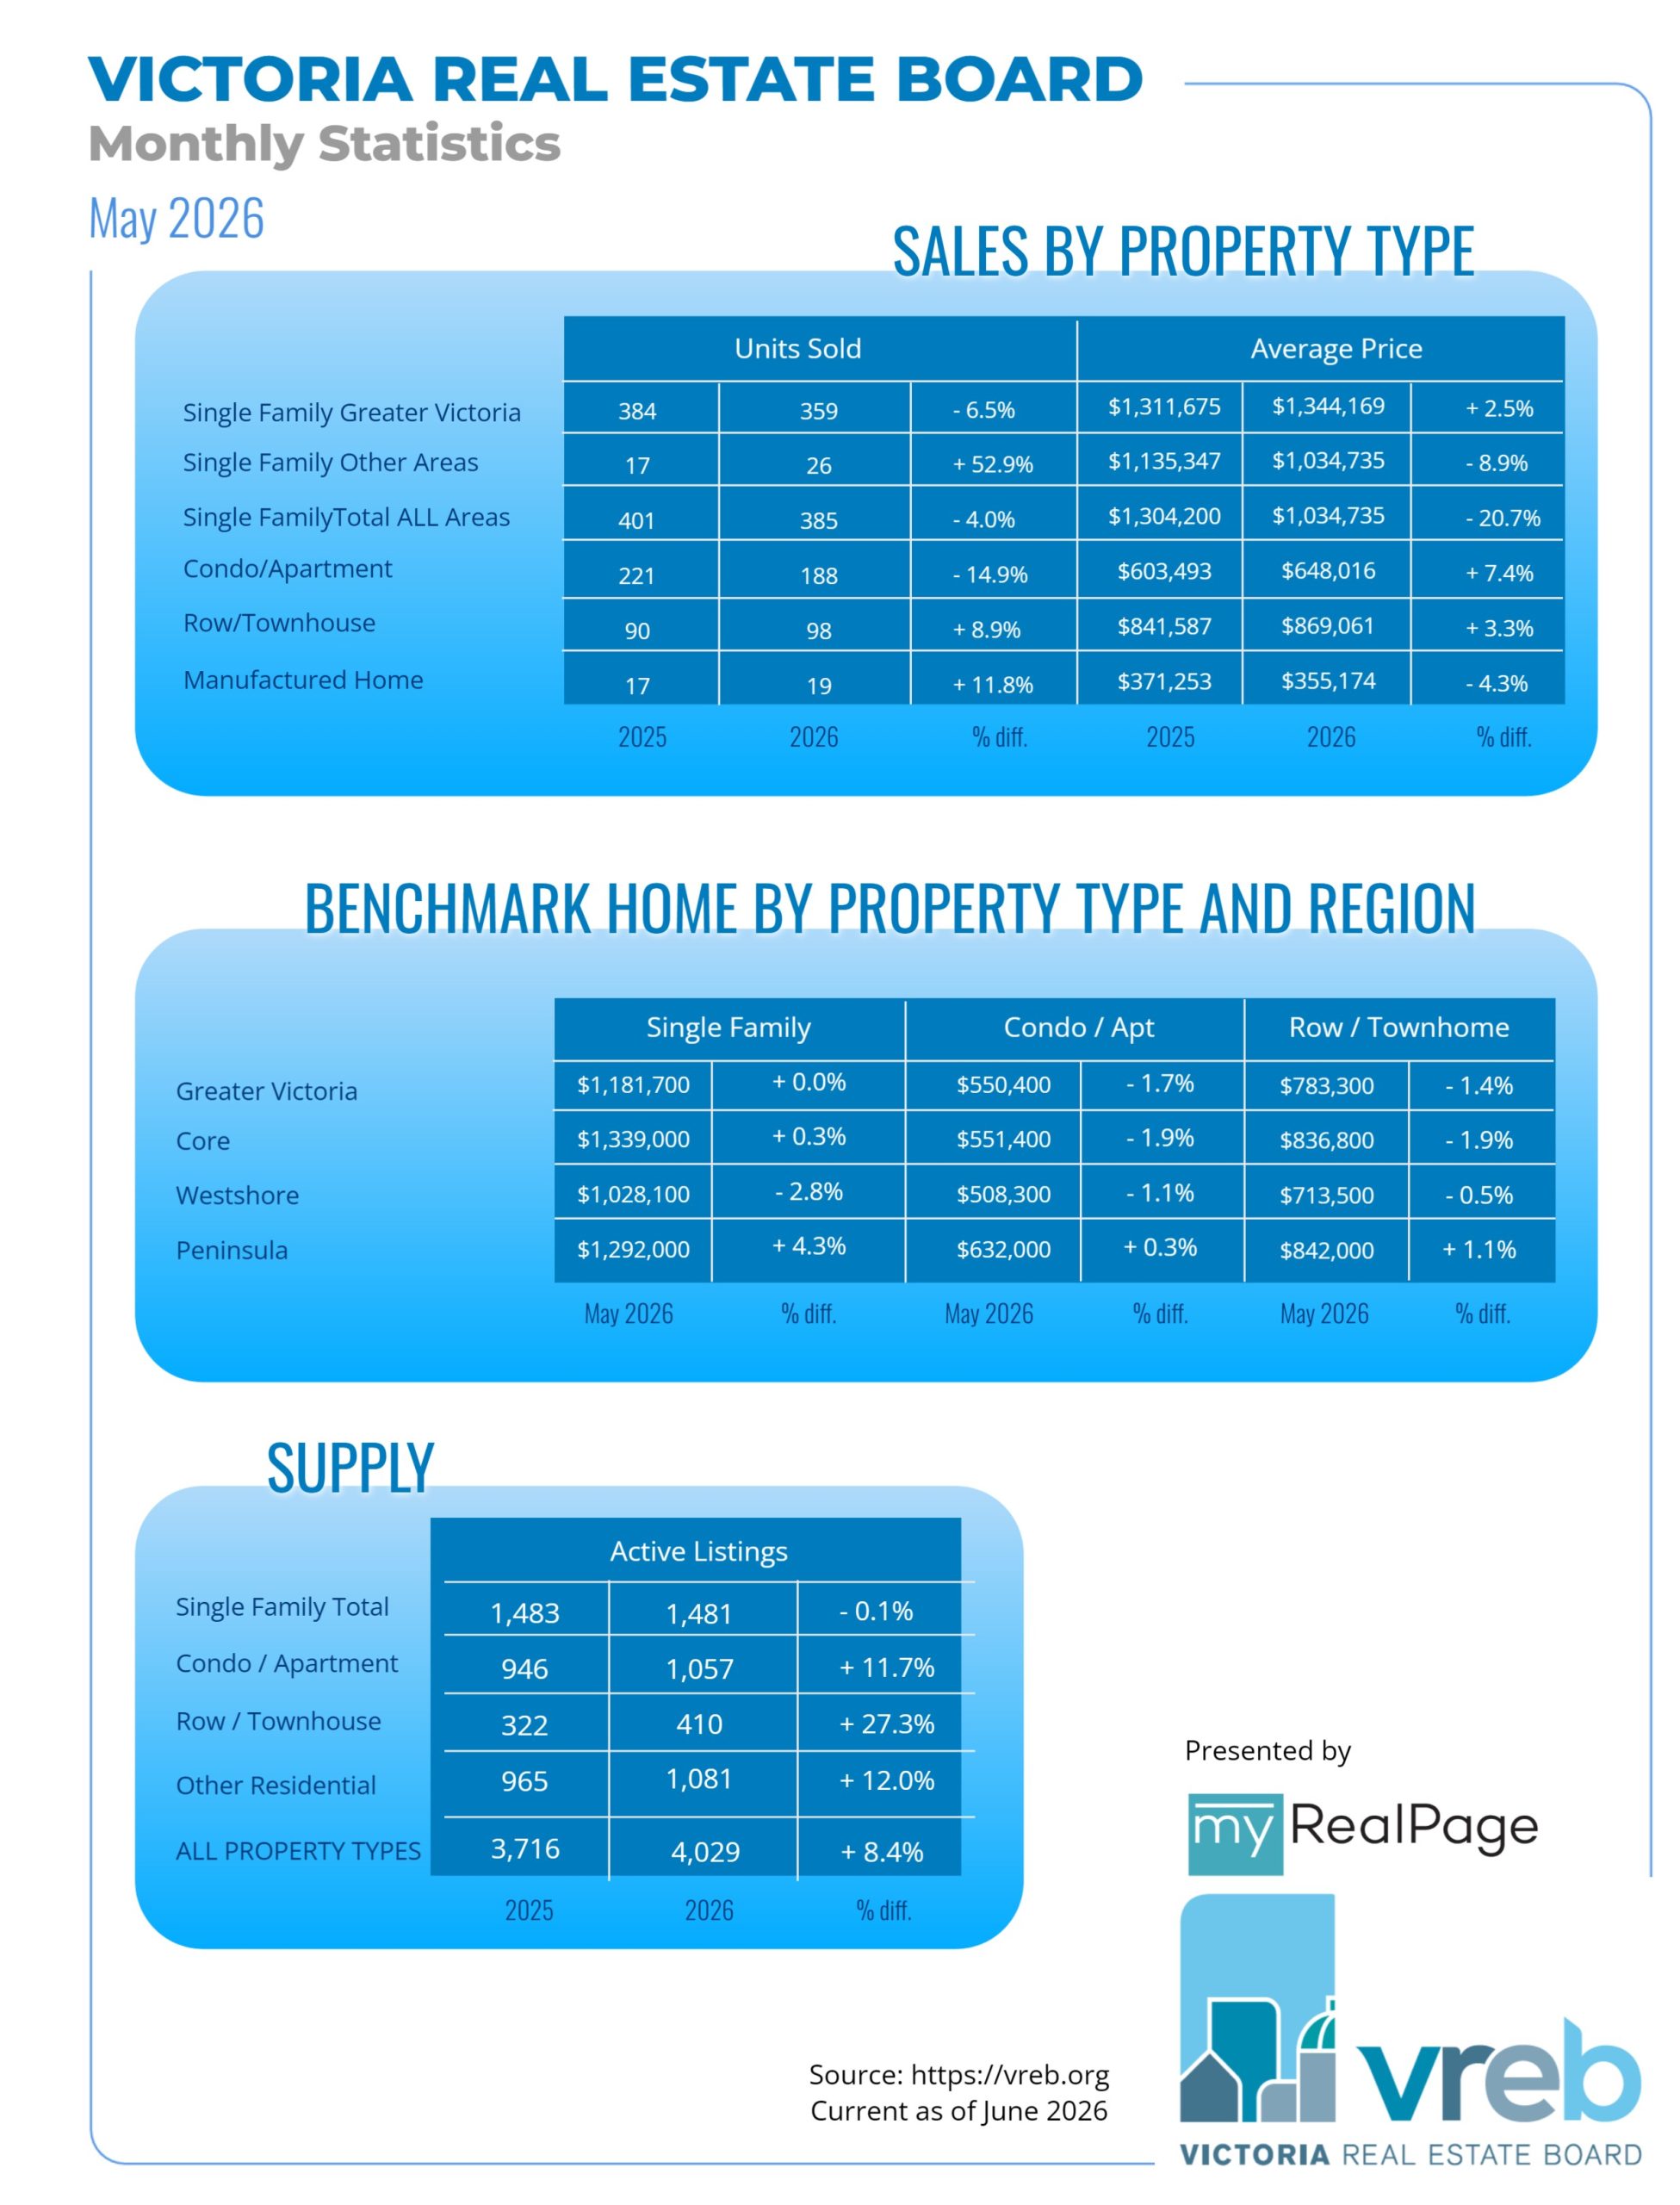
A total of 643 properties sold in the Victoria Real Estate Board region this April, 0.2 per cent more than the 642 properties sold in April 2025 and 11.1 per cent more than in March 2026. Sales of condominiums increased by 5.9 per cent from April 2025 with 198 units sold. Sales of single family homes decreased by 1.2 per cent from April 2025 with 331 sold.
“The overall market in Greater Victoria continues to remain in balance,” said Victoria Real Estate Board Chair Fergus Kyne. “Inventory levels are staying strong, and new listings coming onto market in recent weeks will help serve our traditionally busy spring season. The collective track record from the past several months of balance and stability in our market is likely underpinning the confidence of buyers and sellers this season.”
There were 3,710 active listings for sale on the Victoria Real Estate Board Multiple Listing Service® at the end of April 2026, an increase of 13.8 per cent compared to the previous month of March and an 8.3 per cent increase from the 3,425 active listings for sale at the end of April 2025.
“Current not-too-hot and not-too-cold conditions are setting the stage for a very reasonable spring market for consumers,” notes Chair Kyne. “It’s a Goldilocks real estate market leading into our busier months – and there is choice, inventory is diverse, there is a wide range of properties at different price points, and interest by buyers is also brisk. Of course, your experience can vary depending on where and what type of property you seek in our area, which consists of many different micro-markets. If you’re considering a move this spring season, it’s a great time to connect with your favourite local REALTOR® to weigh your options.”
Read the full report on VREB website!
The following data is a comparison between April 2026 and April 2025 numbers, and is current as of May 2026. Click here to check out last month’s figures!
You can also follow this link for all our Victoria Board monthly infographics!
Click on the images for a larger view!
Download Printable Version – April 2026 VREB, Victoria Market Report
INFOGRAPHICS: March 2026 VREB Victoria Market Reports
Victoria Real Estate Market Report for March 2026
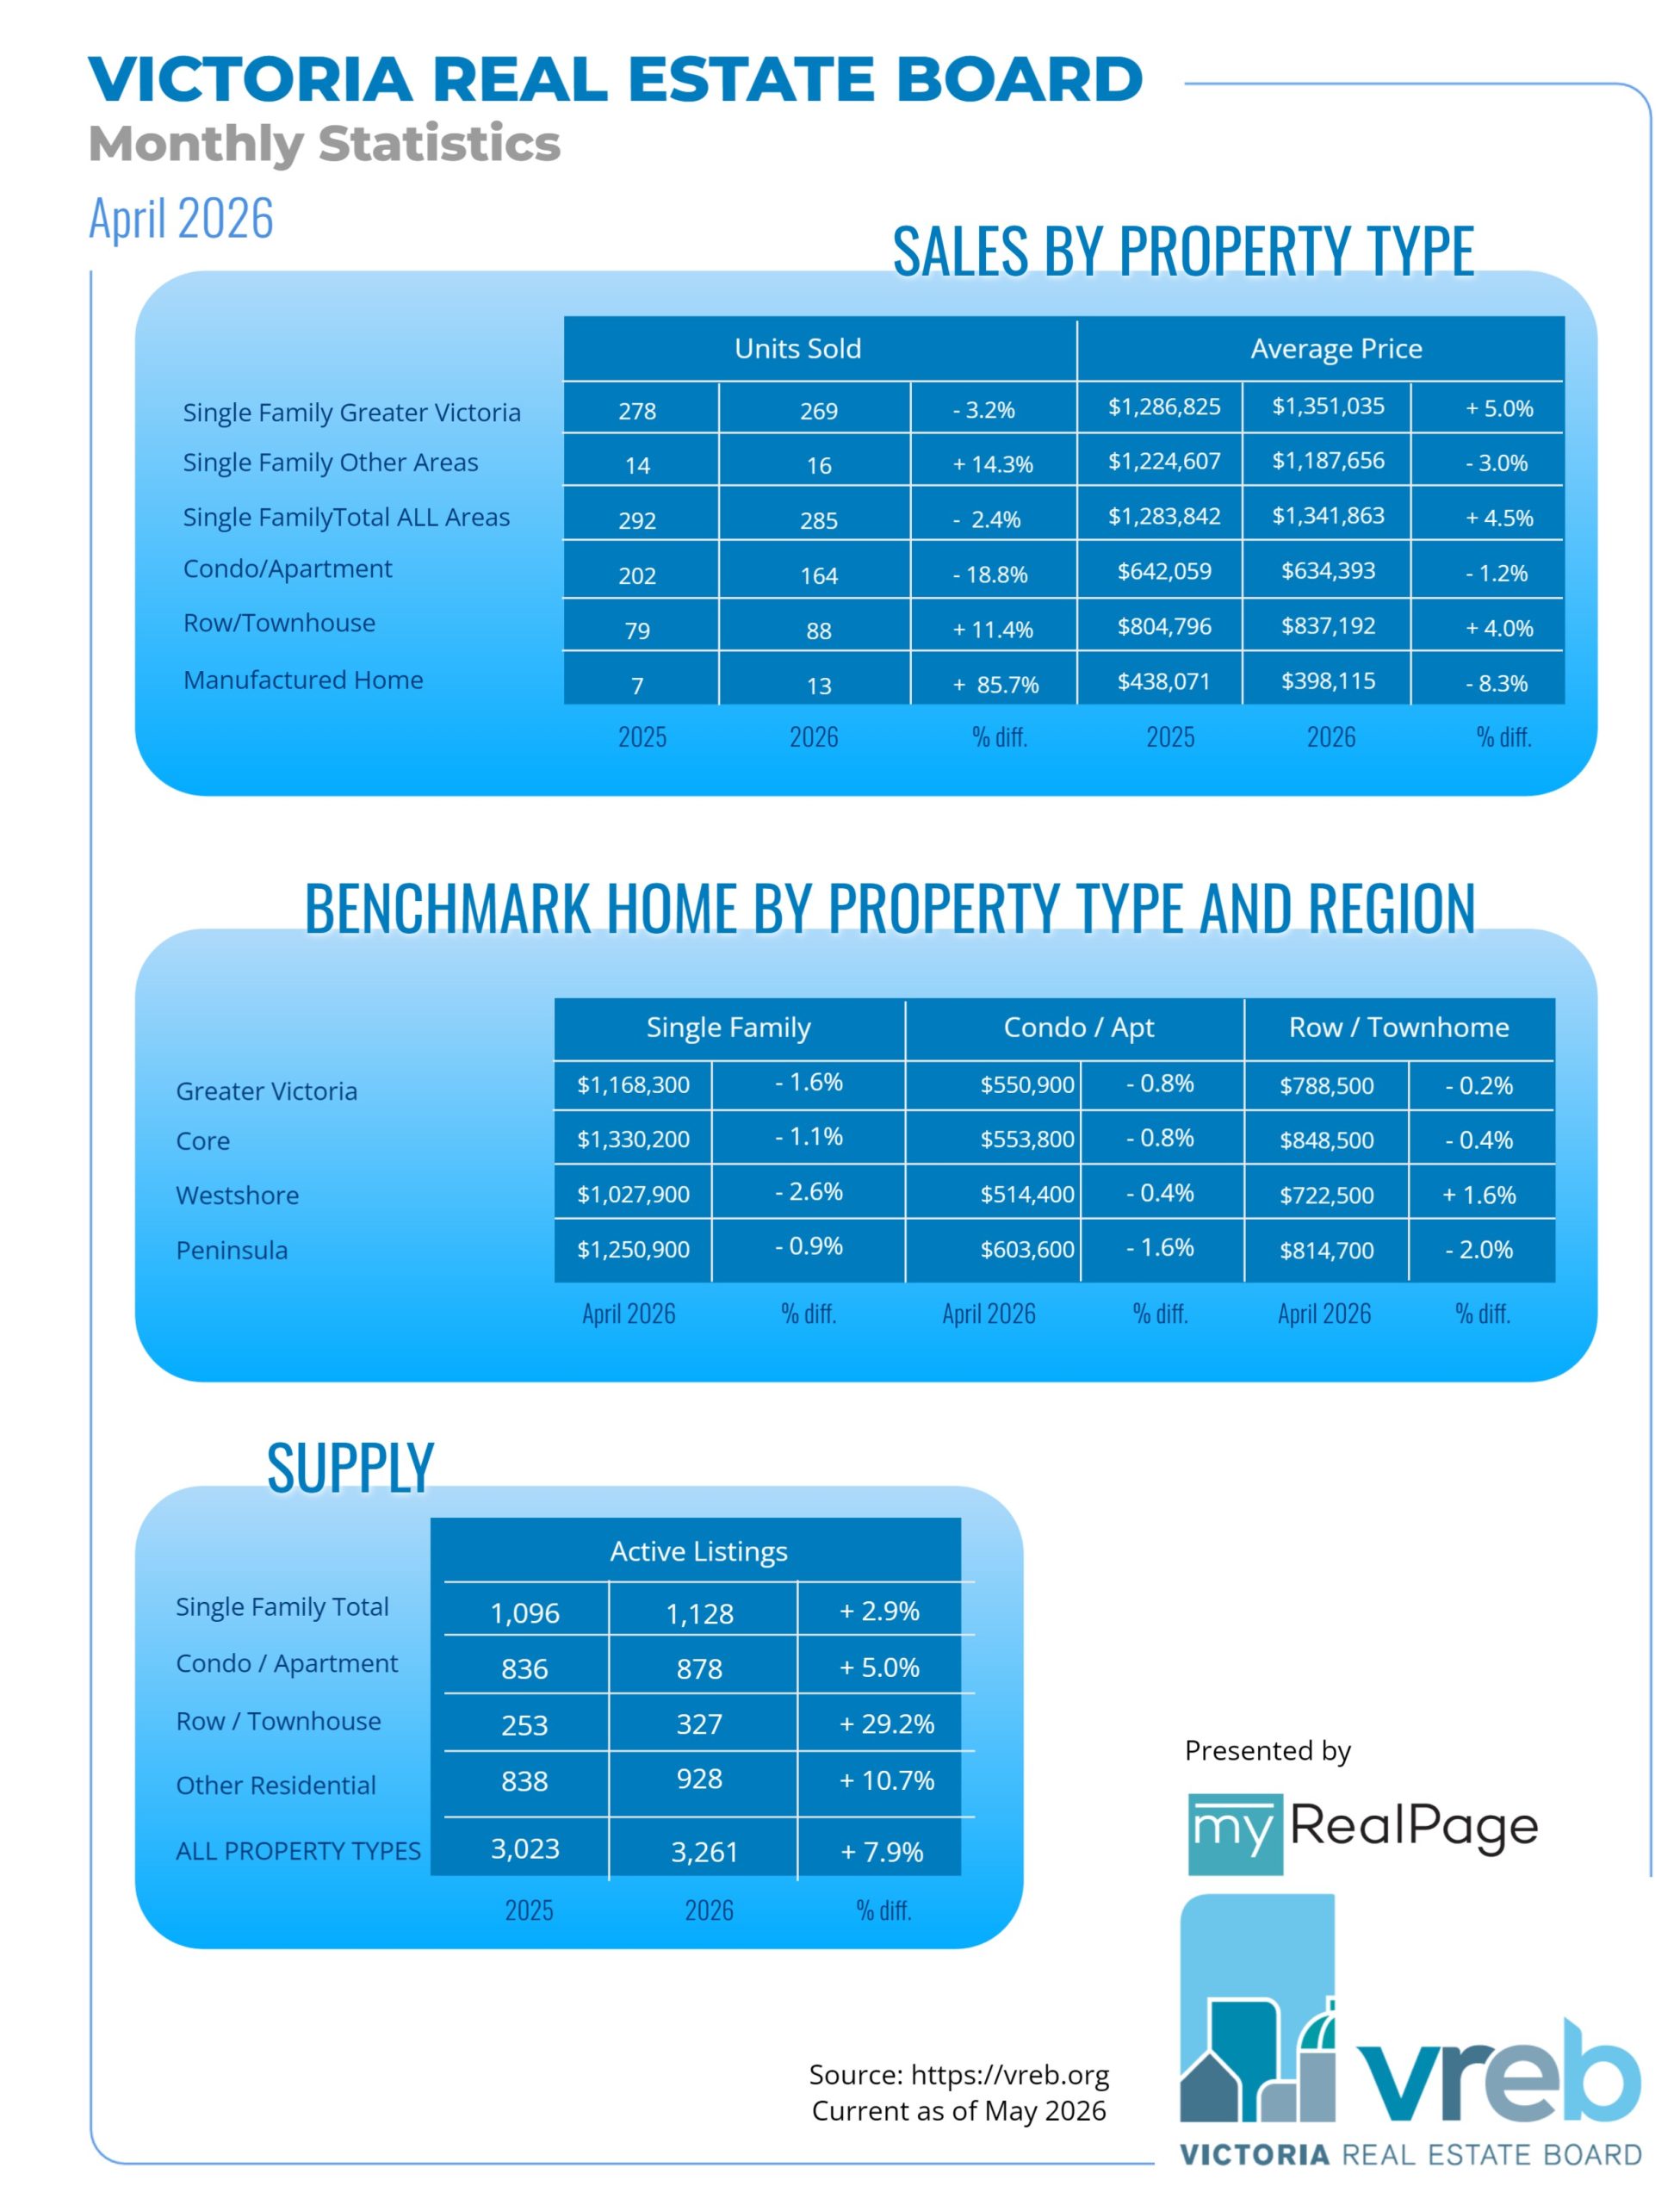
A total of 579 properties sold in the Victoria Real Estate Board region this March, 5.5 per cent fewer than the 613 properties sold in March 2025 and 24.5 per cent more than in February 2026. Sales of condominiums decreased by 18.8 per cent from March 2025 with 164 units sold. Sales of single family homes decreased by 2.4 per cent from March 2025 with 285 sold.
“Our market is following a fairly typical spring market trend,” said Victoria Real Estate Board Chair Fergus Kyne. “With sales and listings both increasing from the previous month, we’re tracking a seasonal pattern that generally builds to the peak of the market in May or June.”
There were 3,261 active listings for sale on the Victoria Real Estate Board Multiple Listing Service® at the end of March 2026, an increase of 12.3 per cent compared to the previous month of February and a 7.9 per cent increase from the 3,023 active listings for sale at the end of March 2025.
Read the full report on VREB website!
The following data is a comparison between March 2026 and March 2025 numbers, and is current as of April 2026. Click here to check out last month’s figures!
You can also follow this link for all our Victoria Board monthly infographics!
Click on the images for a larger view!
Download Printable Version – February 2026 VREB, Victoria Market Report
INFOGRAPHICS: February 2026 VREB Victoria Market Reports
Victoria Real Estate Market Report for February 2026
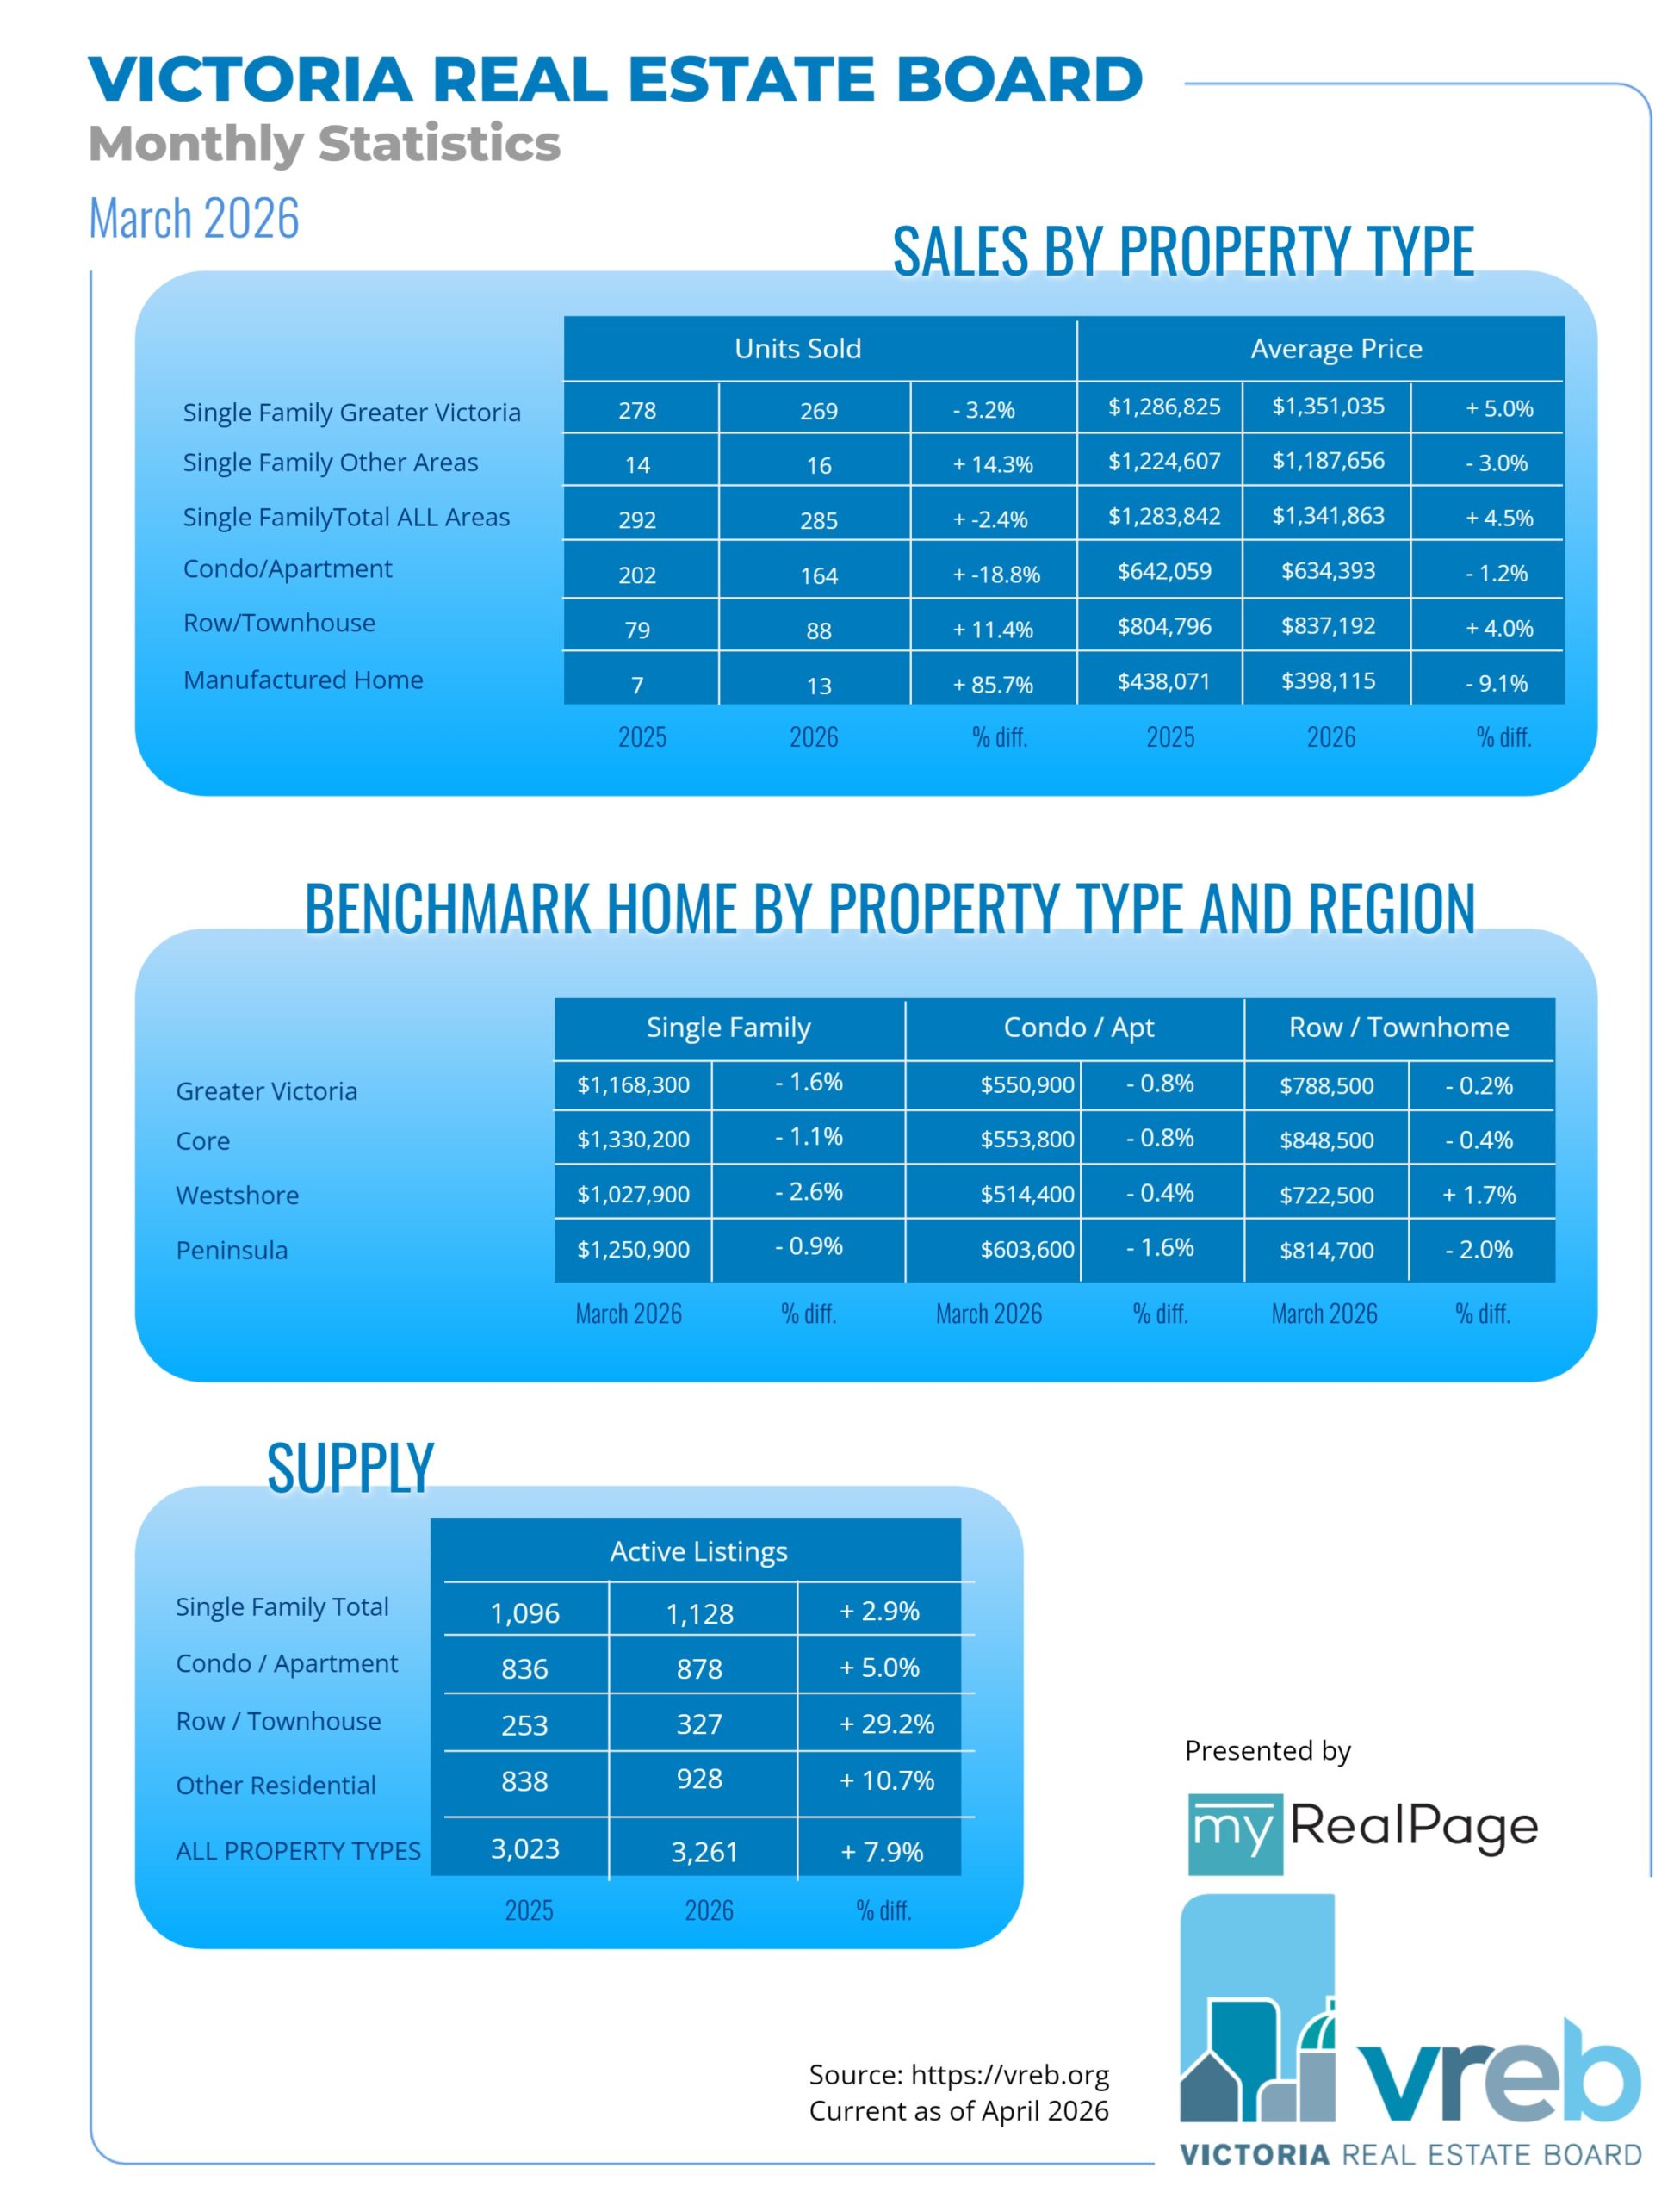
A total of 465 properties sold in the Victoria Real Estate Board region this February, 11.9 per cent fewer than the 528 properties sold in February 2025 and 37.2 per cent more than in January 2026. Sales of condominiums decreased by 19.8 per cent from February 2025 with 154 units sold. Sales of single family homes decreased by 12 per cent from February 2025 with 206 sold.
“February’s sales definitely picked up the pace compared with sales from the previous month,” said Victoria Real Estate Board Chair Fergus Kyne. “Though our sales numbers are lower than they were in 2025, with an over 35 per cent increase month over month, and a very healthy amount of inventory currently available, it will be interesting to see how our spring market unfolds in the upcoming months.”
There were 2,903 active listings for sale on the Victoria Real Estate Board Multiple Listing Service® at the end of February 2026, an increase of 10.6 per cent compared to the previous month of January and a 10.4 per cent increase from the 2,630 active listings for sale at the end of February 2025.
Read the full report on VREB website!
The following data is a comparison between February 2026 and February 2025 numbers, and is current as of March 2026. Click here to check out last month’s figures!
You can also follow this link for all our Victoria Board monthly infographics!
Click on the images for a larger view!
Download Printable Version – February 2026 VREB, Victoria Market Report
INFOGRAPHICS: January 2026 VREB Victoria Market Reports
VREB report for January 2026
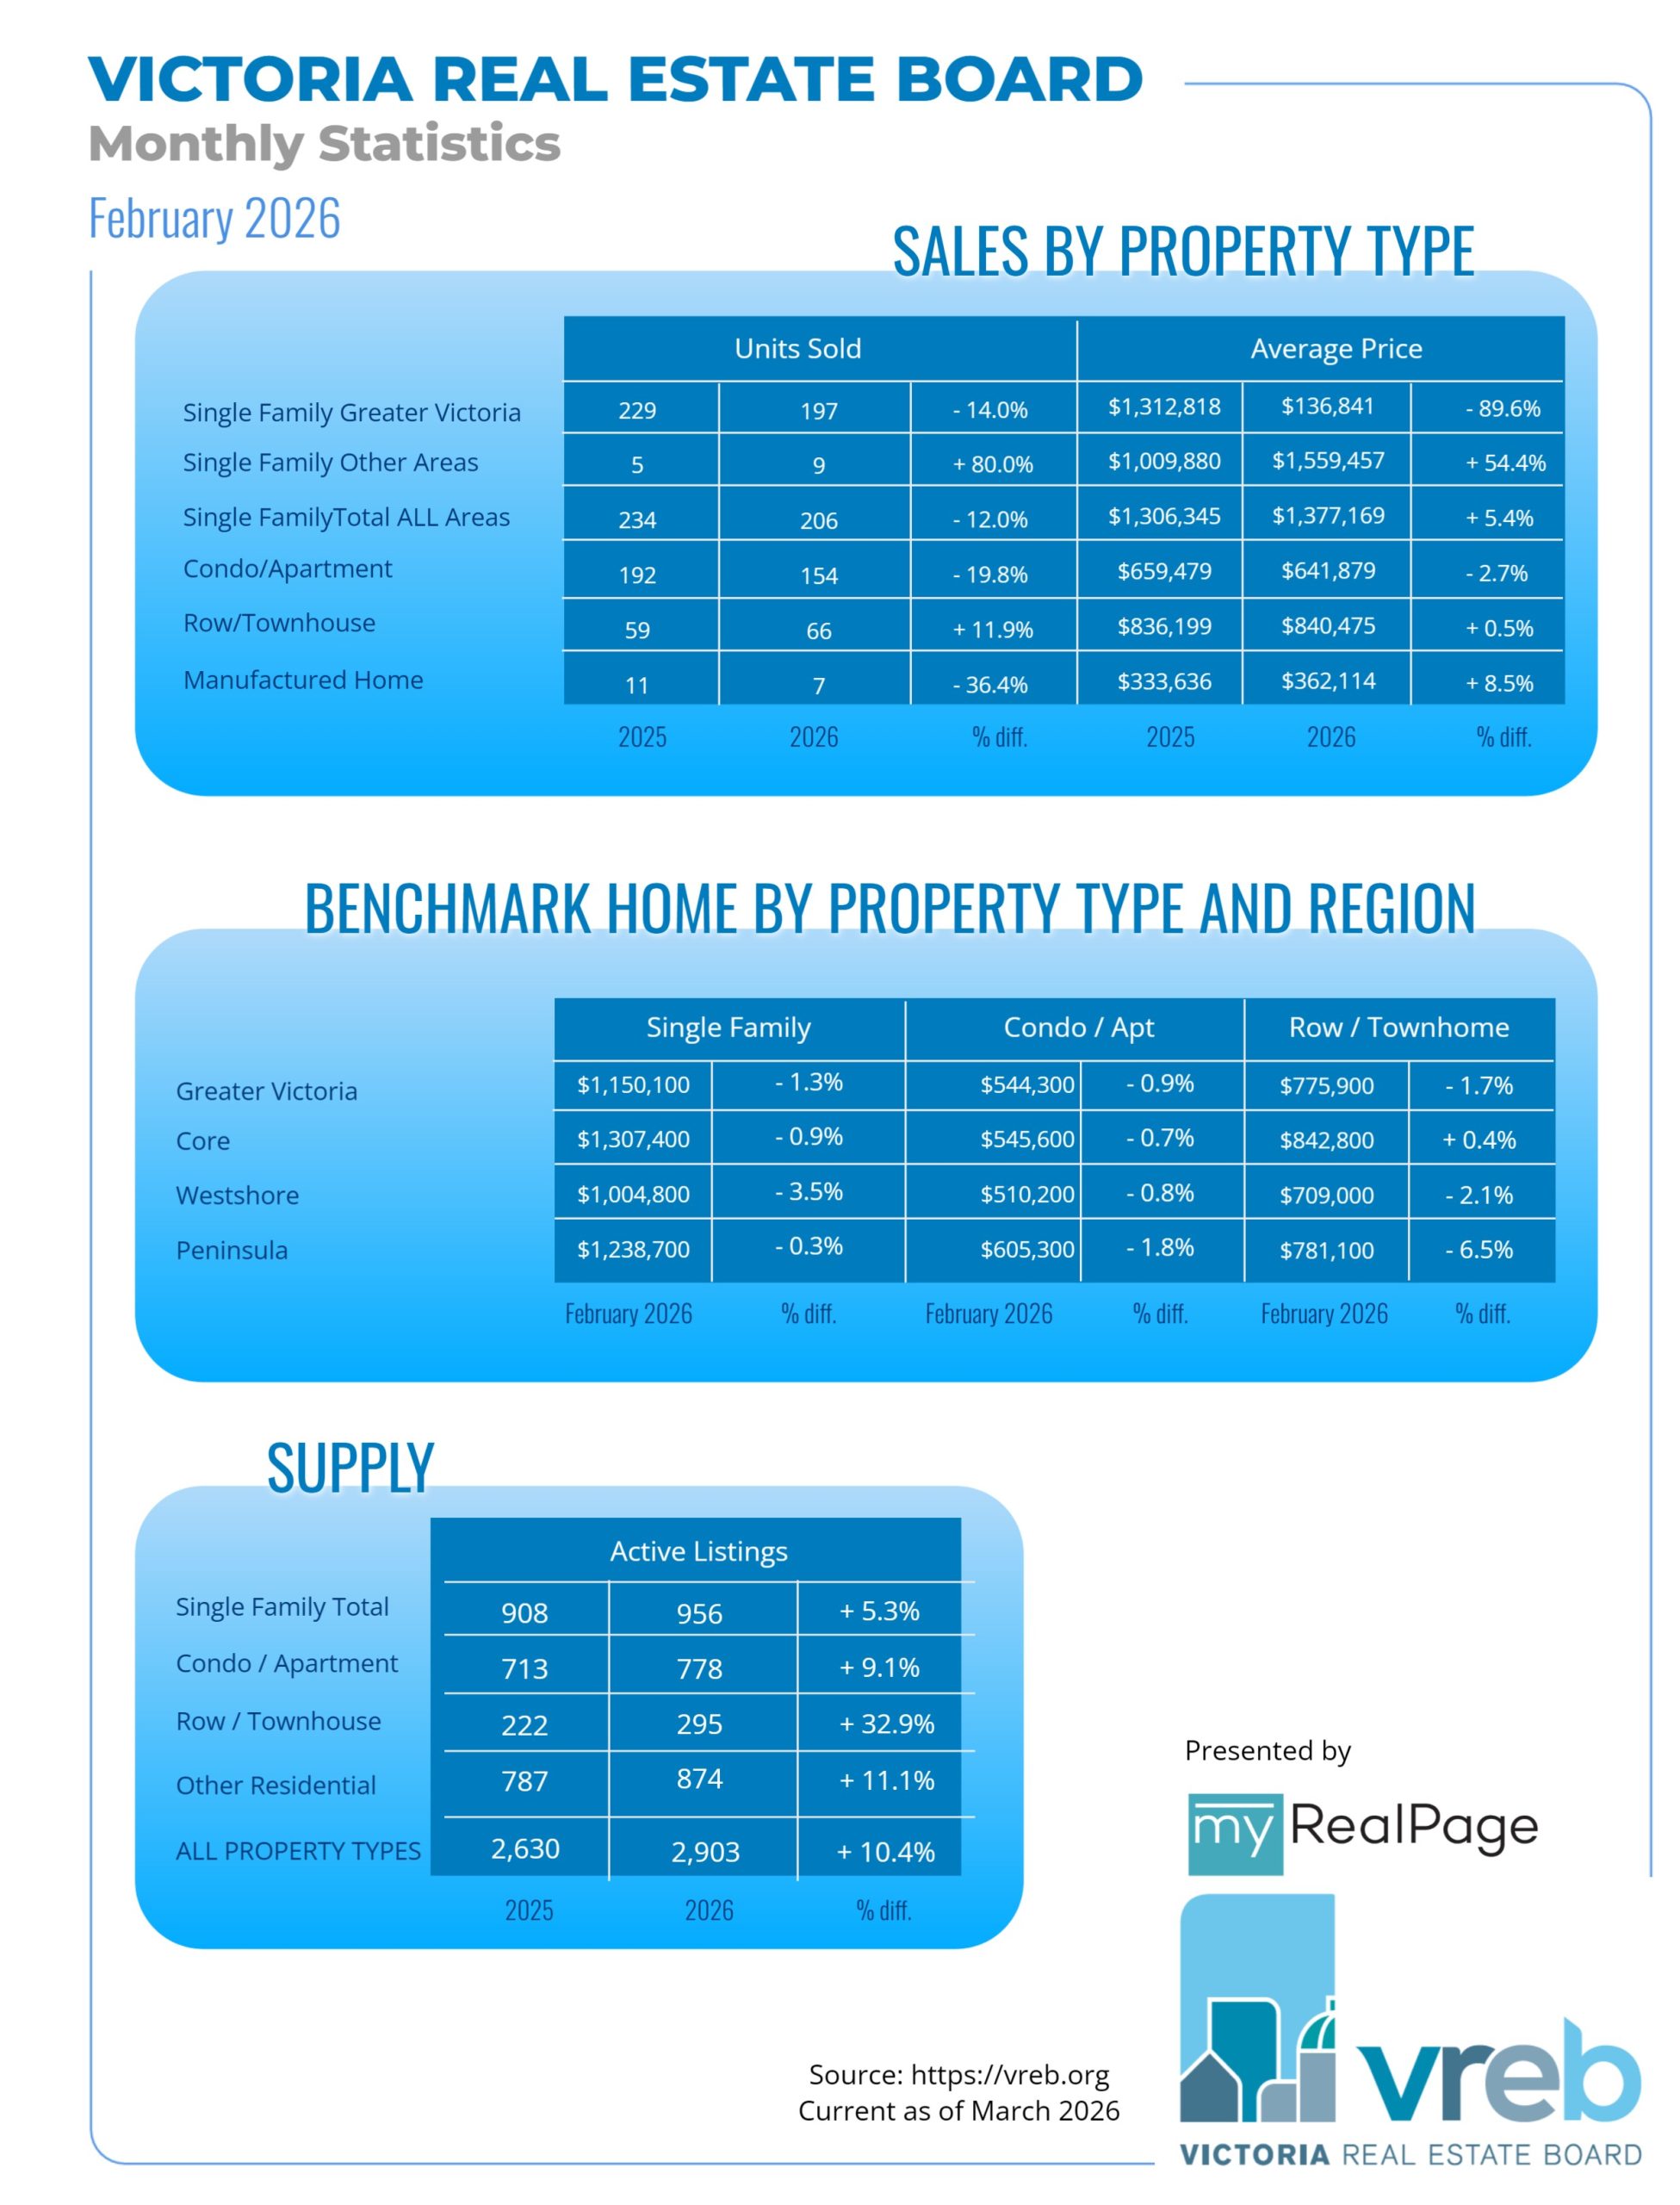
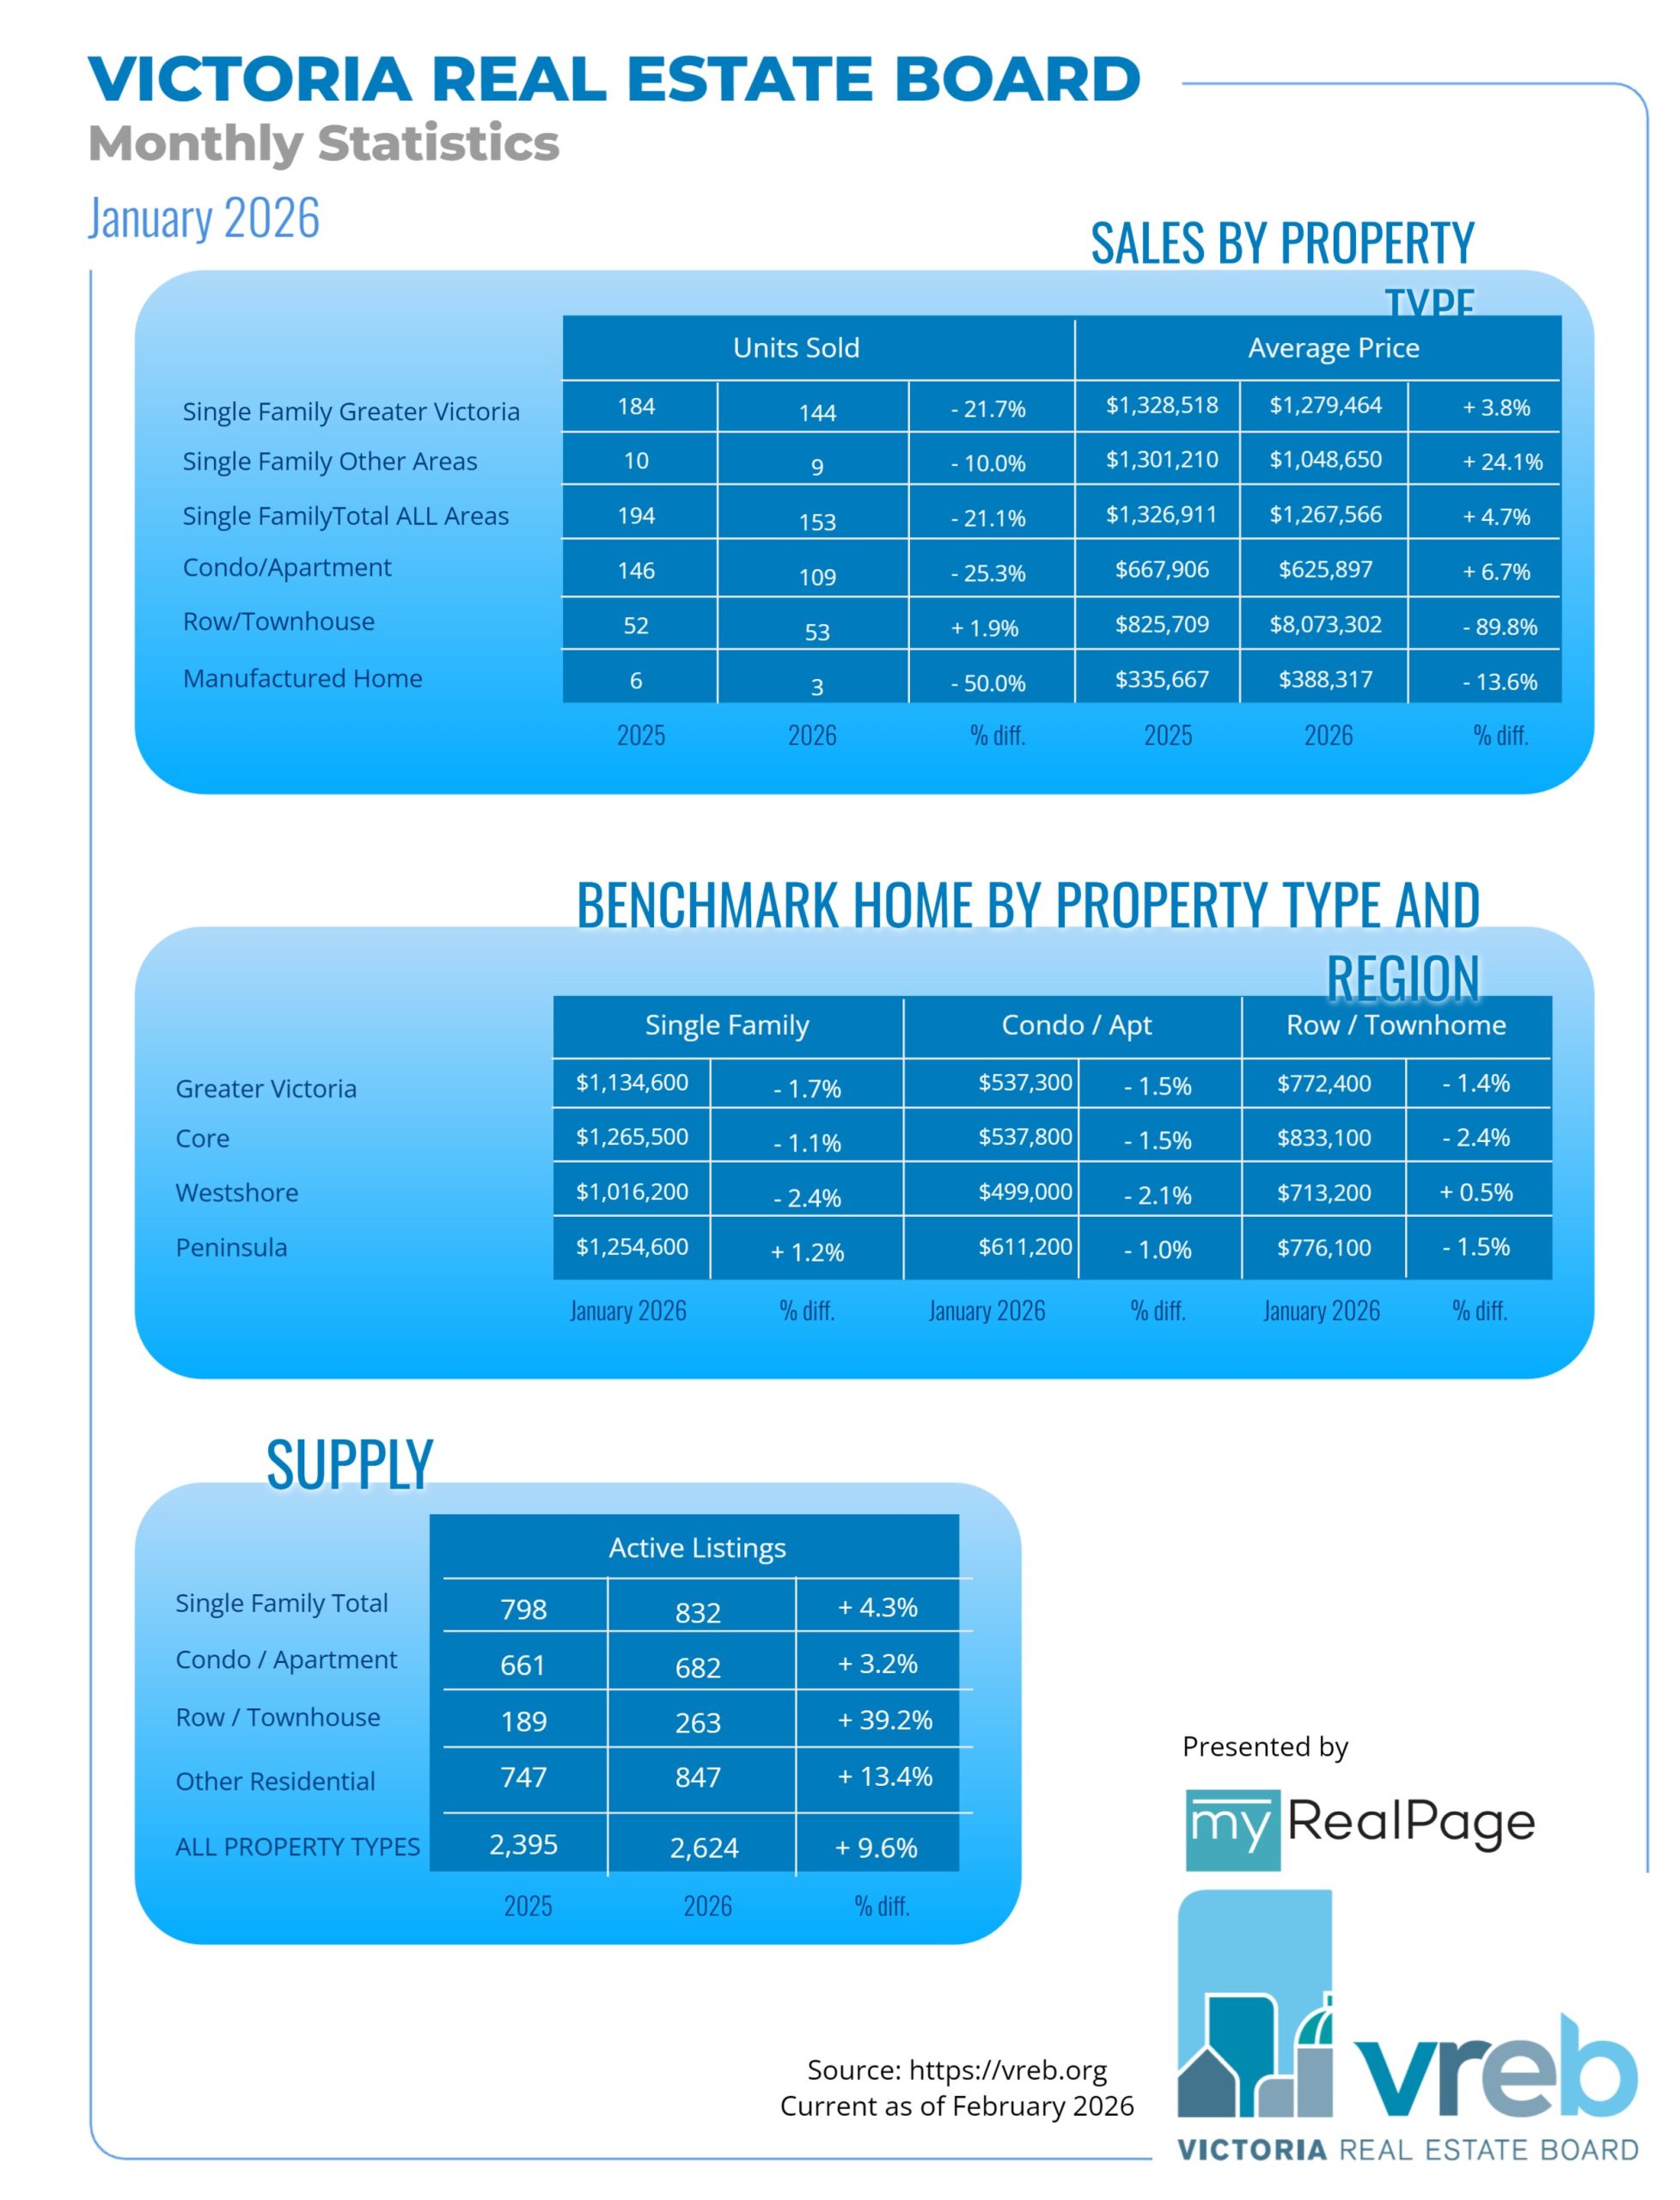
A total of 339 properties sold in the Victoria Real Estate Board region this January, 19.7 per cent fewer than the 422 properties sold in January 2025 and 7.6 per cent fewer than in December 2025. Sales of condominiums decreased by 25.3 per cent from January 2025 with 109 units sold. Sales of single family homes decreased by 21.1 per cent from January 2025 with 153 sold.
“This year kicked off with sales in a similar pattern to what we observed in 2023 and ‘24,” said Victoria Real Estate Board Chair Fergus Kyne. “Those years signalled the return to more predictable, seasonal patterns after the intense pace of the pandemic-influenced market we saw earlier in the decade. Different this year is that there is much more inventory on the market. Healthy levels of inventory that meet demand are critical to smooth out any upward pressure on pricing. As we move through the year, it may well be inventory levels and a combination of external factors like interest rates, global trade tensions, and consumer confidence that ultimately determine the course for our
market.”
There were 2,624 active listings for sale on the Victoria Real Estate Board Multiple Listing Service® at the end of January 2026, an increase of 3.1 per cent compared to the previous month of December and a 9.6 per cent increase from the 2,395 active listings for sale at the end of January 2025.
Read the full report on VREB website!
The following data is a comparison between January 2026 and January 2025 numbers, and is current as of February 2026. Click here to check out last month’s figures!
You can also follow this link for all our Victoria Board monthly infographics!
Click on the images for a larger view!
Download Printable Version – January 2026 VREB, Victoria Market Report
INFOGRAPHICS: December 2025 VREB Victoria Market Reports
Victoria Real Estate Board Market Report – December 2025
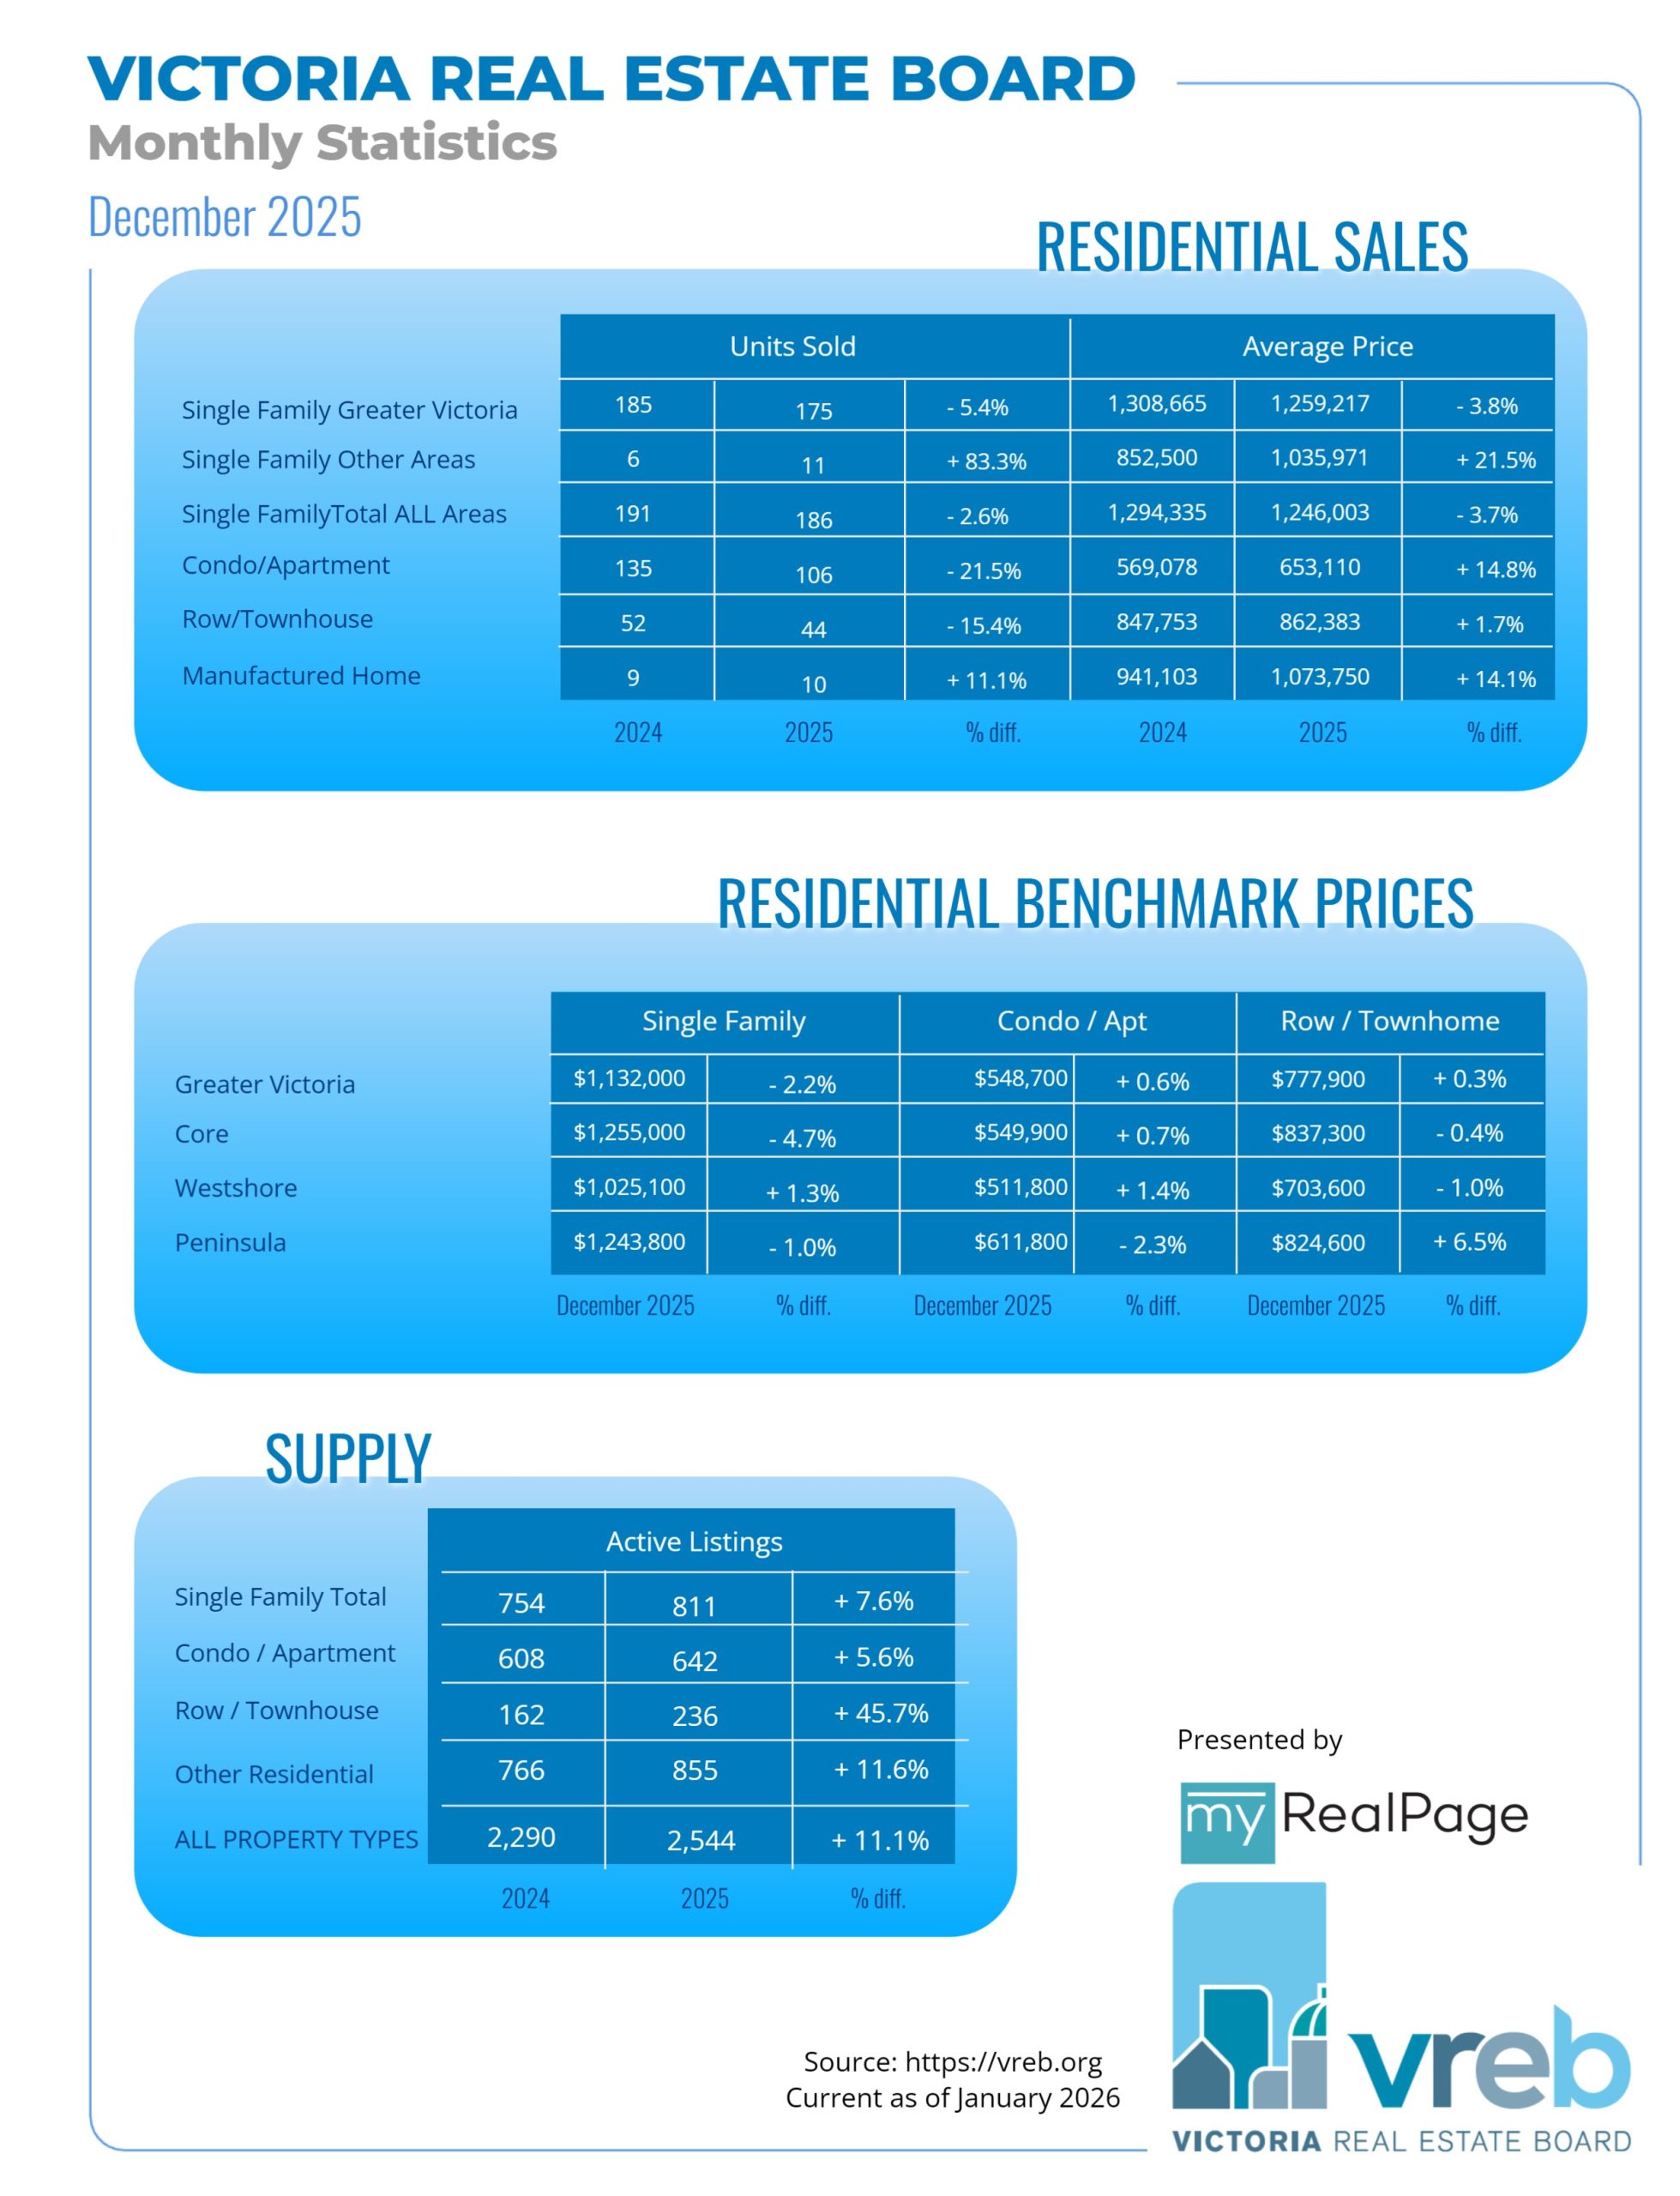
A total of 367 properties sold in the Victoria Real Estate Board region this December, 12.8 per cent fewer than the 421 properties sold in December 2024 and 18.6 per cent fewer than in November 2025. Sales of condominiums were down 21.5 per cent from December 2024 with 106 units sold. Sales of single family homes decreased by 2.6 per cent from December 2024 with 186 sold.
There were 6,918 sales over the course of 2025, a 0.36 per cent increase from the 6,893 sales in 2024. “2025 was another consistent year for local real estate,” said 2026 Victoria Real Estate Board Chair Fergus Kyne. “Despite global economic uncertainty, property sales in the Victoria market were steady and pricing remained relatively balanced. One of the most significant factors in 2025 was the amount of available inventory. We saw the second highest number on record of new listings enter the market. The ample inventory was good news for sellers and for the stability of our market. Buyers had more choice and time to make decisions, while sellers benefitted from clearer expectations around pricing and timelines.”
Read the full report on VREB website!
The following data is a comparison between December 2025 and December 2024 numbers, and is current as of January 2026. Click here to check out last month’s figures!
You can also follow this link for all our Victoria Board monthly infographics!
Click on the images for a larger view!
Download Printable Version – December 2025 VREB, Victoria Market Report

Campbell River
Port Hardy
Box 550-4, 7035 Market Street,
Port Hardy, BC V0N 2P0
Quadra Island
654 Harper Road, Quathiaski Cove
Quadra Island, BC V0P 1N0
MLS DISCLAIMER
Information should be deemed reliable but not guaranteed, all representations are approximate, and individual verification is recommended. Copyright ©2026 All rights reserved. The trademarks REALTOR®, REALTORS® and the REALTOR® logo are controlled by The Canadian Real Estate Association (CREA) and identify real estate professionals who are members of CREA. The trademarks MLS®, Multiple Listing Service® and the associated logos are owned by CREA and identify the quality of services.